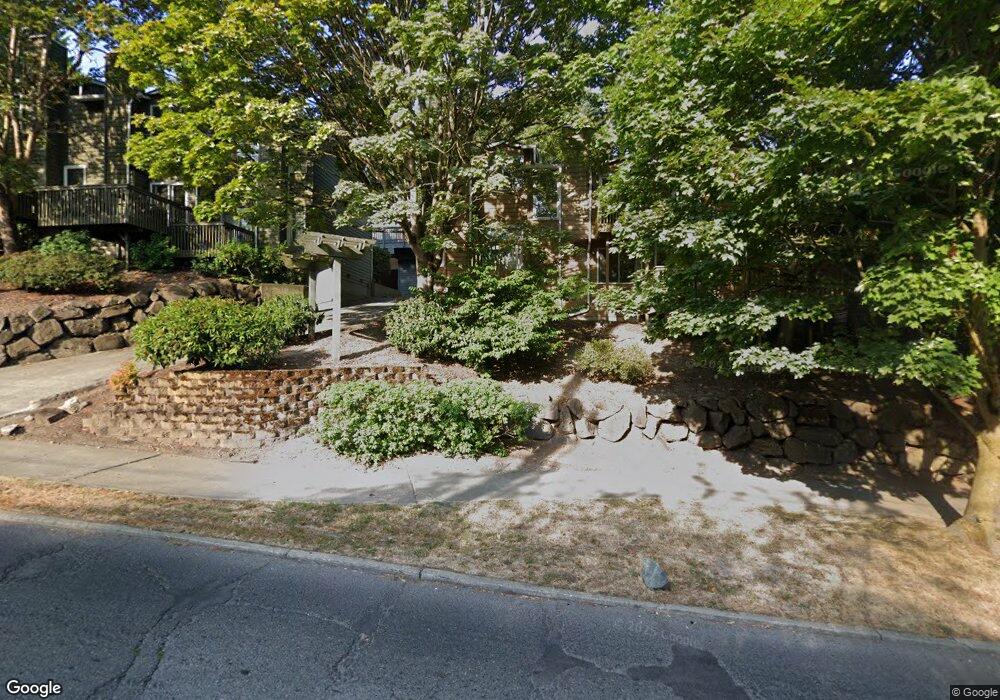
301 W Raye St Unit C109 Seattle, WA 98119
North Queen Anne NeighborhoodEstimated Value: $405,828 - $722,000
2
Beds
2
Baths
754
Sq Ft
$686/Sq Ft
Est. Value
About This Home
This home is located at 301 W Raye St Unit C109, Seattle, WA 98119 and is currently estimated at $517,457, approximately $686 per square foot. 301 W Raye St Unit C109 is a home located in King County with nearby schools including Coe Elementary School, Mcclure Middle School, and Lincoln High School.
Ownership History
Date
Name
Owned For
Owner Type
Purchase Details
Closed on
Apr 21, 2010
Sold by
Ruth Kerry
Bought by
Feil Jonathan I
Current Estimated Value
Home Financials for this Owner
Home Financials are based on the most recent Mortgage that was taken out on this home.
Original Mortgage
$224,000
Outstanding Balance
$148,525
Interest Rate
4.91%
Estimated Equity
$368,932
Purchase Details
Closed on
Jul 27, 2005
Sold by
Kaminski Gary J
Bought by
Ruth Kerry
Home Financials for this Owner
Home Financials are based on the most recent Mortgage that was taken out on this home.
Original Mortgage
$222,400
Interest Rate
6%
Purchase Details
Closed on
Jul 26, 2004
Sold by
R P 26 Llc
Bought by
Kaminski Gary J
Home Financials for this Owner
Home Financials are based on the most recent Mortgage that was taken out on this home.
Original Mortgage
$177,030
Interest Rate
6.29%
Create a Home Valuation Report for This Property
The Home Valuation Report is an in-depth analysis detailing your home's value as well as a comparison with similar homes in the area
Home Values in the Area
Average Home Value in this Area
Purchase History
| Date | Buyer | Sale Price | Title Company |
|---|---|---|---|
| Feil Jonathan I | $280,000 | First American | |
| Ruth Kerry | $278,000 | Chicago Title | |
| Kaminski Gary J | $252,900 | Chicago Title |
Source: Public Records
Mortgage History
| Date | Status | Borrower | Loan Amount |
|---|---|---|---|
| Open | Feil Jonathan I | $224,000 | |
| Previous Owner | Ruth Kerry | $222,400 | |
| Previous Owner | Kaminski Gary J | $177,030 |
Source: Public Records
Tax History Compared to Growth
Tax History
| Year | Tax Paid | Tax Assessment Tax Assessment Total Assessment is a certain percentage of the fair market value that is determined by local assessors to be the total taxable value of land and additions on the property. | Land | Improvement |
|---|---|---|---|---|
| 2024 | $3,953 | $403,000 | $257,600 | $145,400 |
| 2023 | $3,642 | $450,000 | $257,600 | $192,400 |
| 2022 | $3,647 | $422,000 | $236,700 | $185,300 |
| 2021 | $3,990 | $390,000 | $236,700 | $153,300 |
| 2020 | $4,212 | $408,000 | $236,700 | $171,300 |
| 2018 | $3,404 | $414,000 | $215,800 | $198,200 |
| 2017 | $2,767 | $340,000 | $174,000 | $166,000 |
| 2016 | $2,586 | $284,000 | $153,100 | $130,900 |
| 2015 | $2,447 | $259,000 | $139,200 | $119,800 |
| 2014 | -- | $251,000 | $125,300 | $125,700 |
| 2013 | -- | $201,000 | $125,300 | $75,700 |
Source: Public Records
Map
Nearby Homes
- 2611 3rd Ave W
- 2613 3rd Ave W
- 610 W Halladay St
- 2233 2nd Ave W
- 2234 2nd Ave W
- 2446 Queen Anne Ave N
- 2430 8th Ave W
- 807 W Armour St
- 809 W Armour St
- 2520 Warren Ave N
- 2114 7th Ave W
- 29 Etruria St Unit B405
- 0 25 31 37 41 W Dravus St Unit NWM2317147
- 3112 Queen Anne Ave N
- 3116 Queen Anne Ave N
- 36 W Dravus St
- 2108 1st Ave N
- 2110 1st Ave N
- 2102 1st Ave N
- 2130 10th Ave W Unit 28
- 301 W Raye St Unit 106B
- 301 W Raye St
- 301 W Raye St Unit B106
- 301 W Raye St Unit C110
- 301 W Raye St Unit A103
- 301 W Raye St Unit C108
- 301 W Raye St Unit F205
- 301 W Raye St Unit H214
- 301 W Raye St Unit E202
- 301 W Raye St Unit A101
- 301 W Raye St Unit E203
- 301 W Raye St Unit F207
- 301 W Raye St Unit E204
- 301 W Raye St Unit D111
- 301 W Raye St Unit G209
- 301 W Raye St Unit G208
- 301 W Raye St Unit H212
- 301 W Raye St Unit H211