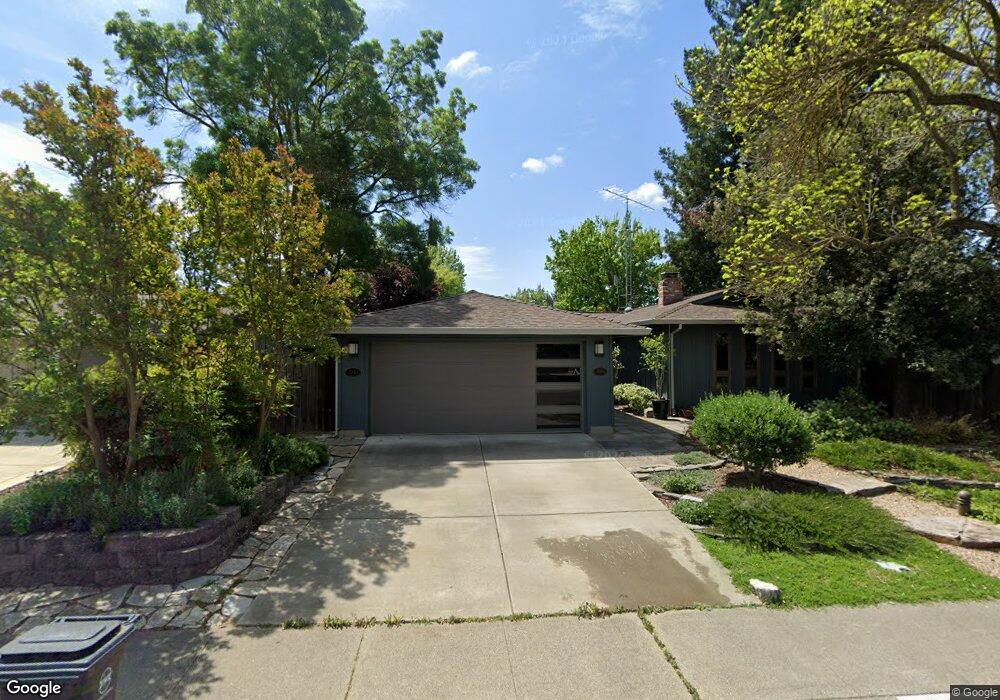
3010 Bryant Place Davis, CA 95618
East Davis NeighborhoodEstimated Value: $582,000 - $720,000
3
Beds
2
Baths
1,426
Sq Ft
$450/Sq Ft
Est. Value
About This Home
This home is located at 3010 Bryant Place, Davis, CA 95618 and is currently estimated at $641,700, approximately $450 per square foot. 3010 Bryant Place is a home located in Yolo County with nearby schools including Fred T. Korematsu Elementary School At Mace Ranch, Frances Ellen Watkins Harper Junior High School, and Davis Senior High School.
Ownership History
Date
Name
Owned For
Owner Type
Purchase Details
Closed on
Jul 16, 2012
Sold by
Hart David M and Hart Joycelyn T
Bought by
Hart Joycelyn T and Hart David M
Current Estimated Value
Home Financials for this Owner
Home Financials are based on the most recent Mortgage that was taken out on this home.
Original Mortgage
$200,000
Outstanding Balance
$137,795
Interest Rate
3.63%
Mortgage Type
New Conventional
Estimated Equity
$503,905
Purchase Details
Closed on
Dec 21, 2009
Sold by
Hart David M and Hart Joycelyn T
Bought by
Hart Joycelyn T and Hart David M
Home Financials for this Owner
Home Financials are based on the most recent Mortgage that was taken out on this home.
Original Mortgage
$157,500
Interest Rate
4.88%
Mortgage Type
New Conventional
Purchase Details
Closed on
May 19, 2006
Sold by
Hart Joycelyn T and Hart David M
Bought by
Livi Joycelyn T and Livi David M Hart Revocable
Create a Home Valuation Report for This Property
The Home Valuation Report is an in-depth analysis detailing your home's value as well as a comparison with similar homes in the area
Home Values in the Area
Average Home Value in this Area
Purchase History
| Date | Buyer | Sale Price | Title Company |
|---|---|---|---|
| Hart Joycelyn T | -- | First American Title Company | |
| Hart David M | -- | First American Title Company | |
| Hart Joycelyn T | -- | Old Republic Title Company | |
| Hart David M | -- | Old Republic Title Company | |
| Livi Joycelyn T | -- | None Available |
Source: Public Records
Mortgage History
| Date | Status | Borrower | Loan Amount |
|---|---|---|---|
| Open | Hart David M | $200,000 | |
| Closed | Hart David M | $157,500 |
Source: Public Records
Tax History
| Year | Tax Paid | Tax Assessment Tax Assessment Total Assessment is a certain percentage of the fair market value that is determined by local assessors to be the total taxable value of land and additions on the property. | Land | Improvement |
|---|---|---|---|---|
| 2025 | $3,489 | $192,924 | $49,946 | $142,978 |
| 2023 | $3,489 | $185,434 | $48,007 | $137,427 |
| 2022 | $3,319 | $181,799 | $47,066 | $134,733 |
| 2021 | $3,221 | $178,236 | $46,144 | $132,092 |
| 2020 | $3,160 | $176,409 | $45,671 | $130,738 |
| 2019 | $2,907 | $172,951 | $44,776 | $128,175 |
| 2018 | $2,731 | $169,561 | $43,899 | $125,662 |
| 2017 | $2,666 | $166,238 | $43,039 | $123,199 |
| 2016 | $2,536 | $162,980 | $42,196 | $120,784 |
| 2015 | $2,453 | $160,533 | $41,563 | $118,970 |
| 2014 | $2,453 | $157,389 | $40,749 | $116,640 |
Source: Public Records
Map
Nearby Homes
- 1619 Monarch Ln
- 2807 Layton Dr
- 2385 Roualt St
- 2309 O'Keeffe Place
- 1107 Baylor Terrace
- 1108 Baylor Terrace
- 1013 Vanderbilt Terrace
- 1007 Vanderbilt Terrace
- 1001 Vanderbilt Terrace
- 3224 Via Verde Terrace
- 1049 Ginkgo Cir
- 2408 Leonardo St
- 1013 Ginkgo Cir
- 1007 Ginkgo Cir
- 2024 Manet Place
- 1001 Ginkgo Cir
- 1421 Vigo Ct
- 1120 Colina Ct
- 2317 E 8th St
- 2806 Audubon Cir
- 3016 Bryant Pl
- 1724 Monarch Ln
- 1726 Monarch Ln
- 1720 Monarch Ln
- 3015 Campbell Place
- 1718 Monarch Ln
- 3021 Campbell Place
- 3022 Bryant Place
- 1714 Monarch Ln
- 3013 Bryant Place
- 3007 Bryant Place
- 1712 Monarch Ln
- 3027 Campbell Place
- 3019 Bryant Place
- 3001 Bryant Place
- 3028 Bryant Place
- 3025 Bryant Place
- 3033 Campbell Place
- 3034 Bryant Place
- 3012 Campbell Place
Your Personal Tour Guide
Ask me questions while you tour the home.