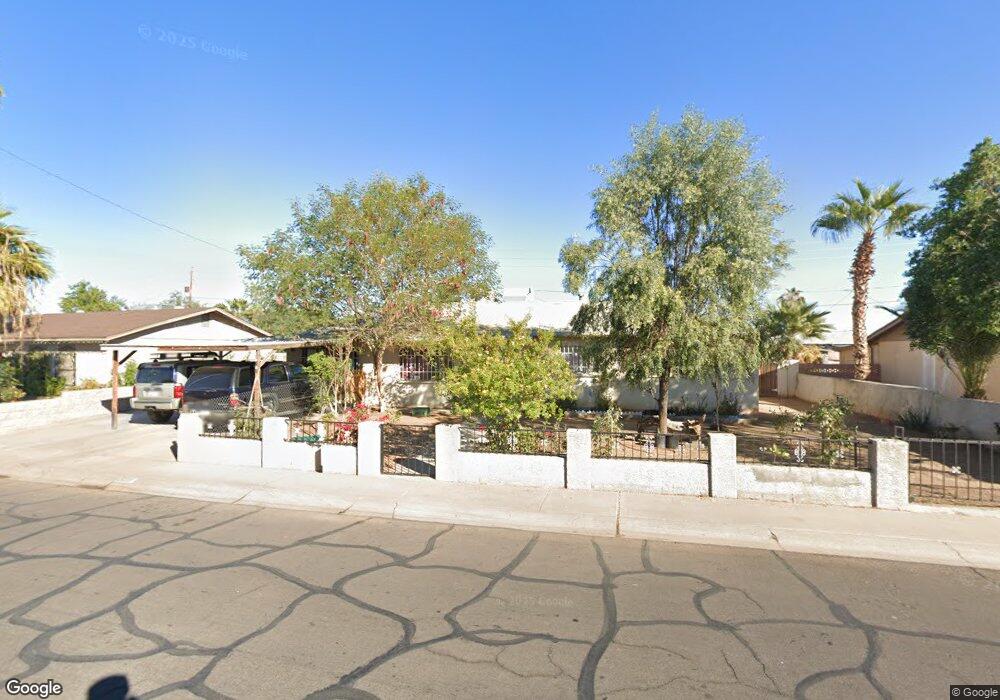
3011 N 40th Ln Phoenix, AZ 85019
Maryvale NeighborhoodEstimated Value: $263,797 - $352,000
3
Beds
2
Baths
1,668
Sq Ft
$196/Sq Ft
Est. Value
About This Home
This home is located at 3011 N 40th Ln, Phoenix, AZ 85019 and is currently estimated at $327,699, approximately $196 per square foot. 3011 N 40th Ln is a home located in Maricopa County with nearby schools including Pueblo Del Sol Middle School, Alhambra High School, and Phoenix Coding Academy.
Ownership History
Date
Name
Owned For
Owner Type
Purchase Details
Closed on
May 27, 2011
Sold by
Cadena Federico Lopez
Bought by
Arizaga Martinez Alicia
Current Estimated Value
Purchase Details
Closed on
May 17, 2011
Sold by
Federal National Mortgage Association
Bought by
Arizaga Martinez Alicia
Purchase Details
Closed on
Mar 9, 2011
Sold by
Rubio Hermelindo G and Rubio Maria M
Bought by
Federal National Mortgage Association
Purchase Details
Closed on
Jun 21, 2001
Sold by
Rubio Maria M
Bought by
Rubio Hermelindo G and Rubio Maria M
Home Financials for this Owner
Home Financials are based on the most recent Mortgage that was taken out on this home.
Original Mortgage
$84,000
Interest Rate
7.15%
Create a Home Valuation Report for This Property
The Home Valuation Report is an in-depth analysis detailing your home's value as well as a comparison with similar homes in the area
Home Values in the Area
Average Home Value in this Area
Purchase History
| Date | Buyer | Sale Price | Title Company |
|---|---|---|---|
| Arizaga Martinez Alicia | -- | Security Title Agency | |
| Arizaga Martinez Alicia | $40,000 | Security Title Agency | |
| Federal National Mortgage Association | $136,924 | Accommodation | |
| Rubio Hermelindo G | -- | Century Title Agency Inc | |
| Rubio Maria M | -- | Century Title Agency Inc |
Source: Public Records
Mortgage History
| Date | Status | Borrower | Loan Amount |
|---|---|---|---|
| Previous Owner | Rubio Maria M | $84,000 |
Source: Public Records
Tax History
| Year | Tax Paid | Tax Assessment Tax Assessment Total Assessment is a certain percentage of the fair market value that is determined by local assessors to be the total taxable value of land and additions on the property. | Land | Improvement |
|---|---|---|---|---|
| 2025 | $752 | $5,118 | -- | -- |
| 2024 | $741 | $4,875 | -- | -- |
| 2023 | $741 | $23,500 | $4,700 | $18,800 |
| 2022 | $703 | $18,610 | $3,720 | $14,890 |
| 2021 | $675 | $15,400 | $3,080 | $12,320 |
| 2020 | $660 | $14,270 | $2,850 | $11,420 |
| 2019 | $645 | $12,320 | $2,460 | $9,860 |
| 2018 | $683 | $11,120 | $2,220 | $8,900 |
| 2017 | $599 | $9,070 | $1,810 | $7,260 |
| 2016 | $863 | $7,480 | $1,490 | $5,990 |
| 2015 | $529 | $6,620 | $1,320 | $5,300 |
Source: Public Records
Map
Nearby Homes
- 3020 N 40th Ave
- 2714 N 40th Ave
- 3823 W Earll Dr
- 4338 W Thomas Rd
- 3025 N 37th Dr
- 4107 W Virginia Ave
- 2646 N 43rd Ave Unit B
- 2652 N 43rd Ave Unit C
- 4420 W Earll Dr
- 4407 W Monterey Way
- 2674 N 43rd Ave Unit D
- 3830 W Crittenden Ln
- 3008 N 45th Dr
- 4155 W Whitton Ave
- 2847 N 46th Ave Unit 10
- 3801 W Wilshire Dr
- 2502 N 38th Ln
- 2846 N 46th Ave Unit 3
- 2301 N 39th Ln
- 4512 W Virginia Ave
- 3001 N 40th Ln
- 3017 N 40th Ln
- 3014 N 40th Dr
- 3008 N 40th Dr
- 3020 N 40th Dr
- 2949 N 40th Ln
- 3023 N 40th Ln Unit SI ID1244329P
- 3023 N 40th Ln Unit ID1244329P
- 3023 N 40th Ln
- 3016 N 40th Ln
- 3002 N 40th Dr
- 3002 N 40th Ln
- 3006 N 41st Dr
- 3022 N 40th Ln
- 3026 N 40th Dr
- 2952 N 40th Ln
- 2945 N 40th Ln
- 3029 N 40th Ln
- 3012 N 41st Dr
- 3017 N 40th Dr
Your Personal Tour Guide
Ask me questions while you tour the home.