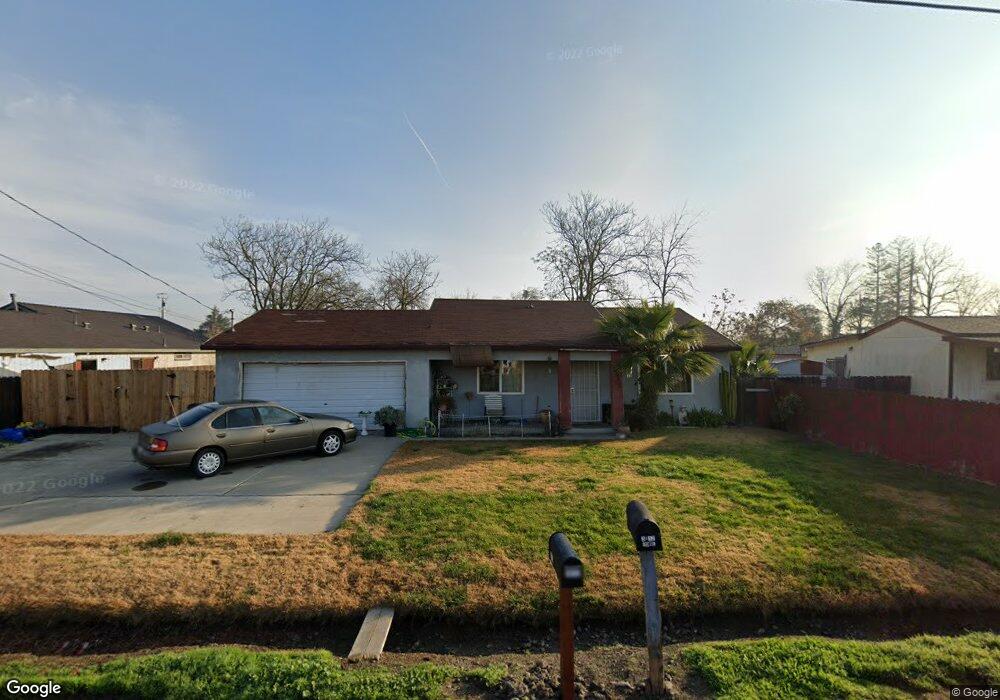
3012 Howe Ave Stockton, CA 95206
Seaport NeighborhoodEstimated Value: $310,000 - $339,000
2
Beds
1
Bath
1,008
Sq Ft
$322/Sq Ft
Est. Value
About This Home
This home is located at 3012 Howe Ave, Stockton, CA 95206 and is currently estimated at $324,585, approximately $322 per square foot. 3012 Howe Ave is a home located in San Joaquin County with nearby schools including Taft Elementary School, McKinley Elementary School, and Dolores Huerta Elementary School.
Ownership History
Date
Name
Owned For
Owner Type
Purchase Details
Closed on
Aug 13, 2018
Sold by
Doug W Johnson Inc
Bought by
Sephos Steve A
Current Estimated Value
Purchase Details
Closed on
May 27, 2011
Sold by
Gabbard John M
Bought by
Sephos Steve A
Purchase Details
Closed on
Apr 20, 2011
Sold by
Williams Kimberly A
Bought by
Sephos Steve A and Gabbard John M
Purchase Details
Closed on
Nov 17, 2004
Sold by
Williams Mark C
Bought by
Williams Kimberly A
Home Financials for this Owner
Home Financials are based on the most recent Mortgage that was taken out on this home.
Original Mortgage
$125,000
Interest Rate
5.79%
Mortgage Type
New Conventional
Purchase Details
Closed on
Aug 28, 2001
Sold by
Williams Mark C
Bought by
Williams Kimberly P
Create a Home Valuation Report for This Property
The Home Valuation Report is an in-depth analysis detailing your home's value as well as a comparison with similar homes in the area
Home Values in the Area
Average Home Value in this Area
Purchase History
| Date | Buyer | Sale Price | Title Company |
|---|---|---|---|
| Sephos Steve A | $12,000 | Placer Title Company | |
| Sephos Steve A | $10,000 | None Available | |
| Sephos Steve A | $150,094 | None Available | |
| Williams Kimberly A | -- | Placer Title Company | |
| Williams Kimberly P | -- | -- |
Source: Public Records
Mortgage History
| Date | Status | Borrower | Loan Amount |
|---|---|---|---|
| Previous Owner | Williams Kimberly A | $125,000 |
Source: Public Records
Tax History
| Year | Tax Paid | Tax Assessment Tax Assessment Total Assessment is a certain percentage of the fair market value that is determined by local assessors to be the total taxable value of land and additions on the property. | Land | Improvement |
|---|---|---|---|---|
| 2025 | $1,571 | $110,867 | $35,432 | $75,435 |
| 2024 | $1,621 | $108,694 | $34,738 | $73,956 |
| 2023 | $1,504 | $106,563 | $34,057 | $72,506 |
| 2022 | $1,439 | $104,475 | $33,390 | $71,085 |
| 2021 | $1,389 | $102,428 | $32,736 | $69,692 |
| 2020 | $1,230 | $86,686 | $21,085 | $65,601 |
| 2019 | $1,202 | $84,987 | $20,672 | $64,315 |
| 2018 | $1,189 | $83,321 | $20,267 | $63,054 |
| 2017 | $1,133 | $81,688 | $19,870 | $61,818 |
| 2016 | $1,151 | $80,087 | $19,481 | $60,606 |
| 2014 | $1,098 | $77,339 | $18,812 | $58,527 |
Source: Public Records
Map
Nearby Homes
- 3323 S El Dorado St
- 3335 S El Dorado St
- 2510 S Harrison St
- 544 W 9th St
- 354 W 7th St
- 421 E 8th St
- 220 Delhi Ave
- 407 W 7th St
- 3707 French Camp
- 769 Colorado Ave
- 2343 S Sacramento St
- 719 Hyde Ct
- 707 Queensland Cir
- 1954 S Sutter St
- 3812 Ramalho Ln Unit IN
- 2020 S American St
- 2319 S Union St
- 231 E 5th St
- 1731 S Center St
- 1827 S California St
Your Personal Tour Guide
Ask me questions while you tour the home.