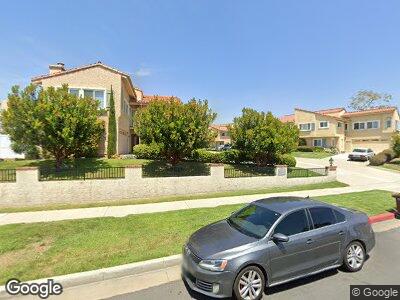
3016 Camino Capistrano Unit 9 San Clemente, CA 92672
Capistrano Beach NeighborhoodEstimated Value: $949,696 - $1,082,000
2
Beds
2
Baths
1,420
Sq Ft
$712/Sq Ft
Est. Value
About This Home
This home is located at 3016 Camino Capistrano Unit 9, San Clemente, CA 92672 and is currently estimated at $1,010,424, approximately $711 per square foot. 3016 Camino Capistrano Unit 9 is a home located in Orange County with nearby schools including Palisades Elementary School, Shorecliffs Middle School, and San Clemente High School.
Ownership History
Date
Name
Owned For
Owner Type
Purchase Details
Closed on
Feb 15, 2021
Sold by
Anderson Patricia R and Anderson Patricia R
Bought by
Anderson Jodine Kay and Patricia R Anderson Family Tru
Current Estimated Value
Purchase Details
Closed on
Mar 23, 2007
Sold by
Anderson Patricia R
Bought by
Anderson Patricia R and Patricia R Anderson Revocable Intervivos
Home Financials for this Owner
Home Financials are based on the most recent Mortgage that was taken out on this home.
Original Mortgage
$0
Interest Rate
7.87%
Mortgage Type
Negative Amortization
Purchase Details
Closed on
Mar 2, 2007
Sold by
Anderson Patricia R
Bought by
Anderson Patricia R and Patricia R Anderson Revocable Intervivos
Home Financials for this Owner
Home Financials are based on the most recent Mortgage that was taken out on this home.
Original Mortgage
$0
Interest Rate
7.87%
Mortgage Type
Negative Amortization
Create a Home Valuation Report for This Property
The Home Valuation Report is an in-depth analysis detailing your home's value as well as a comparison with similar homes in the area
Home Values in the Area
Average Home Value in this Area
Purchase History
| Date | Buyer | Sale Price | Title Company |
|---|---|---|---|
| Anderson Jodine Kay | -- | None Available | |
| Anderson Patricia R | -- | Accommodation | |
| Anderson Patricia R | -- | Accommodation | |
| Anderson Patricia R | -- | Accommodation |
Source: Public Records
Mortgage History
| Date | Status | Borrower | Loan Amount |
|---|---|---|---|
| Closed | Anderson Patricia R | $0 | |
| Closed | Anderson Patricia R | $160,000 | |
| Closed | Anderson Patricia R | $50,000 |
Source: Public Records
Tax History Compared to Growth
Tax History
| Year | Tax Paid | Tax Assessment Tax Assessment Total Assessment is a certain percentage of the fair market value that is determined by local assessors to be the total taxable value of land and additions on the property. | Land | Improvement |
|---|---|---|---|---|
| 2024 | $3,070 | $245,762 | $75,504 | $170,258 |
| 2023 | $2,957 | $240,944 | $74,024 | $166,920 |
| 2022 | $2,856 | $236,220 | $72,572 | $163,648 |
| 2021 | $2,711 | $231,589 | $71,149 | $160,440 |
| 2020 | $2,717 | $229,215 | $70,420 | $158,795 |
| 2019 | $2,658 | $224,721 | $69,039 | $155,682 |
| 2018 | $2,589 | $220,315 | $67,685 | $152,630 |
| 2017 | $2,519 | $215,996 | $66,358 | $149,638 |
| 2016 | $2,448 | $211,761 | $65,057 | $146,704 |
| 2015 | $2,288 | $208,581 | $64,080 | $144,501 |
| 2014 | $2,247 | $204,496 | $62,825 | $141,671 |
Source: Public Records
Map
Nearby Homes
- 111 Via Breve Unit 24
- 2918 Camino Capistrano Unit 10A
- 2918 Camino Capistrano Unit 10B
- 2914 Camino Capistrano Unit 12A
- 110 Del Gado Rd Unit 14
- 2903 Camino Capistrano Unit 10
- 2911 La Ventana
- 249 Monte Vista Unit 8
- 35767 Beach Rd
- 35651 Beach Rd
- 35451 Camino Capistrano
- 35615 Beach Rd
- 27525 Via Valor
- 35587 Beach Rd
- 35857 Beach Rd
- 102 Bay Dr
- 114 Shell Dr
- 102 Surf Dr
- 35213 Del Rey
- 103 Ocean Dr
- 3016 Camino Capistrano Unit 9
- 3014 Camino Capistrano
- 111 Via Breve
- 101 Via Breve
- 3006 Camino Capistrano Unit 4
- 3010 Camino Capistrano Unit 6
- 3012 Camino Capistrano Unit 7
- 3002 Camino Capistrano Unit 2
- 3006 Camino Capistrano
- 3008 Camino Capistrano Unit 5
- 3018 Camino Capistrano Unit 10
- 3012 Camino Capistrano
- 3010 Camino Capistrano
- 3004 Camino Capistrano Unit 3
- 3002 Camino Capistrano
- 3000 Camino Capistrano
- 113 Via Breve
- 115 Via Breve Unit 22
- 115 Via Breve
- 2922 Camino Capistrano Unit B