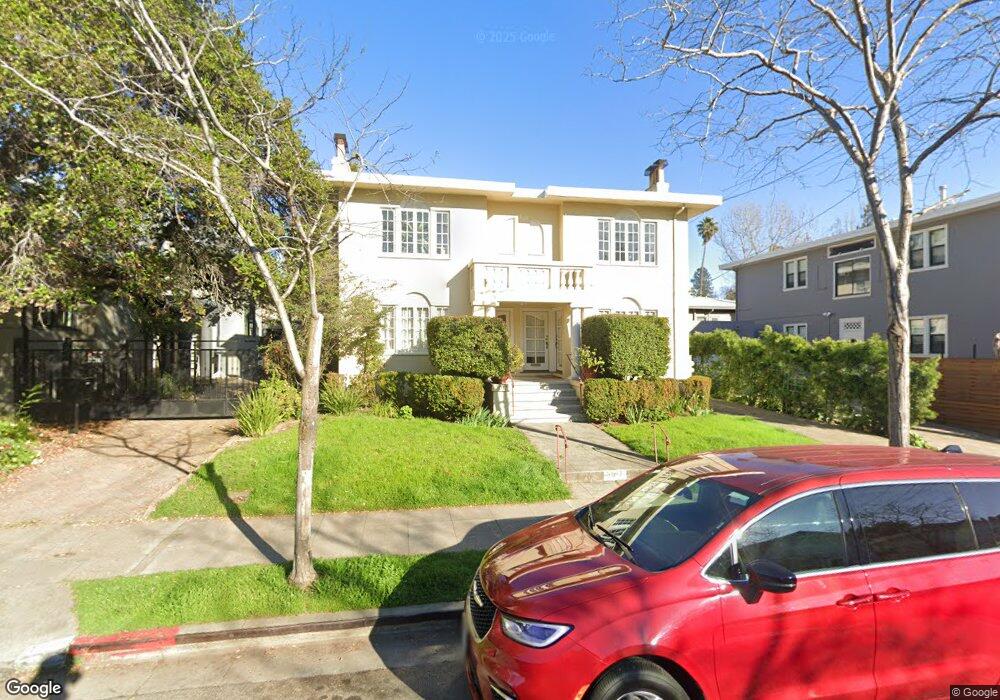
3017 College Ave Unit 1 Berkeley, CA 94705
Elmwood NeighborhoodEstimated Value: $570,000 - $829,000
2
Beds
1
Bath
859
Sq Ft
$798/Sq Ft
Est. Value
About This Home
This home is located at 3017 College Ave Unit 1, Berkeley, CA 94705 and is currently estimated at $685,901, approximately $798 per square foot. 3017 College Ave Unit 1 is a home located in Alameda County with nearby schools including Emerson Elementary School, John Muir Elementary School, and Malcolm X Elementary School.
Ownership History
Date
Name
Owned For
Owner Type
Purchase Details
Closed on
Dec 26, 1995
Sold by
Whitridge John H and Whitridge Trudy A
Bought by
Davidson James W
Current Estimated Value
Home Financials for this Owner
Home Financials are based on the most recent Mortgage that was taken out on this home.
Original Mortgage
$82,500
Outstanding Balance
$2,241
Interest Rate
7.36%
Mortgage Type
Purchase Money Mortgage
Estimated Equity
$683,660
Purchase Details
Closed on
Mar 23, 1995
Sold by
Steuart John D and Steuart Barbara E
Bought by
Whitridge John H and Whitridge Trudy A
Home Financials for this Owner
Home Financials are based on the most recent Mortgage that was taken out on this home.
Original Mortgage
$103,000
Interest Rate
6.87%
Mortgage Type
Purchase Money Mortgage
Create a Home Valuation Report for This Property
The Home Valuation Report is an in-depth analysis detailing your home's value as well as a comparison with similar homes in the area
Home Values in the Area
Average Home Value in this Area
Purchase History
| Date | Buyer | Sale Price | Title Company |
|---|---|---|---|
| Davidson James W | $132,500 | Placer Title Company | |
| Whitridge John H | -- | Placer Title Company |
Source: Public Records
Mortgage History
| Date | Status | Borrower | Loan Amount |
|---|---|---|---|
| Open | Davidson James W | $82,500 | |
| Previous Owner | Whitridge John H | $103,000 |
Source: Public Records
Tax History Compared to Growth
Tax History
| Year | Tax Paid | Tax Assessment Tax Assessment Total Assessment is a certain percentage of the fair market value that is determined by local assessors to be the total taxable value of land and additions on the property. | Land | Improvement |
|---|---|---|---|---|
| 2025 | $4,027 | $213,103 | $66,114 | $153,989 |
| 2024 | $4,027 | $208,787 | $64,817 | $150,970 |
| 2023 | $3,932 | $211,557 | $63,547 | $148,010 |
| 2022 | $3,844 | $200,409 | $62,301 | $145,108 |
| 2021 | $3,838 | $196,342 | $61,079 | $142,263 |
| 2020 | $3,612 | $201,258 | $60,453 | $140,805 |
| 2019 | $3,442 | $197,313 | $59,268 | $138,045 |
| 2018 | $3,374 | $193,445 | $58,106 | $135,339 |
| 2017 | $3,231 | $189,653 | $56,967 | $132,686 |
| 2016 | $3,101 | $185,934 | $55,850 | $130,084 |
| 2015 | $3,056 | $183,143 | $55,012 | $128,131 |
| 2014 | $3,026 | $179,556 | $53,934 | $125,622 |
Source: Public Records
Map
Nearby Homes
- 2477 Prince St
- 2951 Linden Ave
- 6446 Colby St
- 2243 Ashby Ave
- 2702 Dana St
- 2611 Piedmont Ave Unit 4
- 5687 Miles Ave
- 2732 Parker St
- 204 El Camino Real
- 5936 Broadway
- 2543 Chilton Way
- 2110 Ashby Ave
- 3050 Shattuck Ave
- 669 Alcatraz Ave
- 1488 Alvarado Rd
- 2550 Dana St Unit 2F
- 6555 Shattuck Ave
- 6320 Shattuck Ave
- 2316 Blake St Unit D
- 2537 Ellsworth St
- 3017 College Ave Unit 4
- 3017 College Ave Unit 3
- 3017 College Ave Unit 2
- 3011 College Ave
- 2701 Prince St
- 2707 Prince St
- 3001 College Ave
- 2715 Prince St
- 2708 Webster St
- 3018 College Ave Unit 3018
- 2713 Prince St
- 2700 Webster St
- 2700 Prince St
- 2704 Webster St
- 2716 Webster St
- 3016 College Ave
- 3026 College Ave
- 3014 College Ave
- 3028 College Ave
- 3034 College Ave