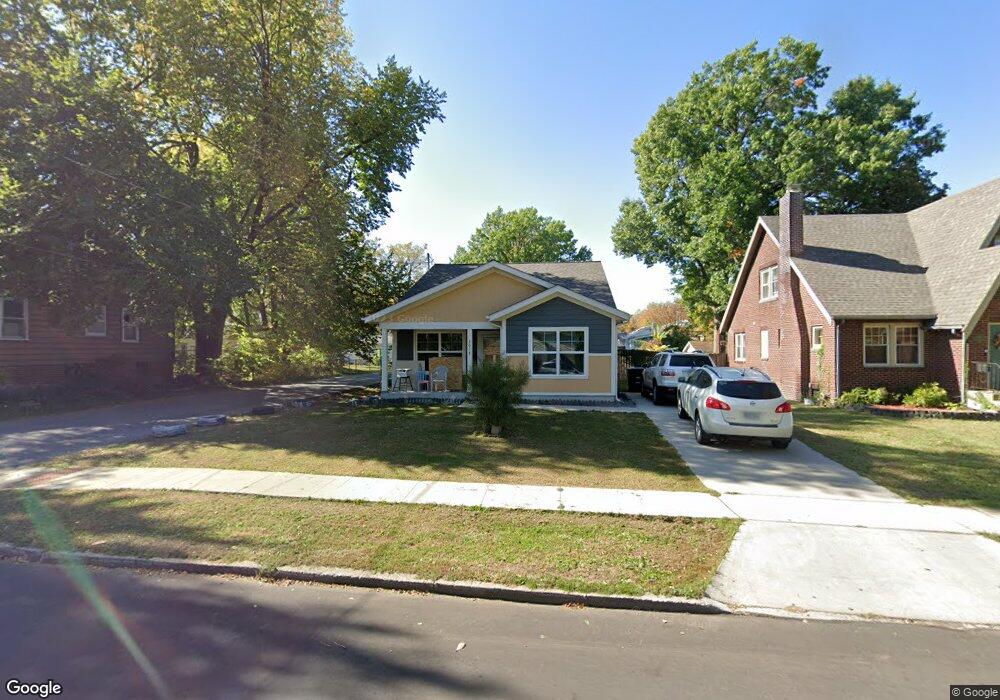
3018 York St Des Moines, IA 50316
Highland Park NeighborhoodEstimated Value: $205,000 - $239,000
3
Beds
2
Baths
1,138
Sq Ft
$193/Sq Ft
Est. Value
About This Home
This home is located at 3018 York St, Des Moines, IA 50316 and is currently estimated at $219,728, approximately $193 per square foot. 3018 York St is a home located in Polk County with nearby schools including Cattell Elementary School, Harding Middle School, and North High School.
Ownership History
Date
Name
Owned For
Owner Type
Purchase Details
Closed on
Jun 15, 2018
Sold by
Greater Des Moines Habitat For Humanity
Bought by
Eltom Yasmin Arbab
Current Estimated Value
Home Financials for this Owner
Home Financials are based on the most recent Mortgage that was taken out on this home.
Original Mortgage
$68,832
Outstanding Balance
$59,661
Interest Rate
4.6%
Mortgage Type
Stand Alone First
Estimated Equity
$160,067
Purchase Details
Closed on
Dec 19, 2016
Sold by
City Of Des Moines
Bought by
Greater Des Moines Habitat For Humanity
Create a Home Valuation Report for This Property
The Home Valuation Report is an in-depth analysis detailing your home's value as well as a comparison with similar homes in the area
Home Values in the Area
Average Home Value in this Area
Purchase History
| Date | Buyer | Sale Price | Title Company |
|---|---|---|---|
| Eltom Yasmin Arbab | $141,500 | None Available | |
| Greater Des Moines Habitat For Humanity | $4,500 | None Available |
Source: Public Records
Mortgage History
| Date | Status | Borrower | Loan Amount |
|---|---|---|---|
| Open | Eltom Yasmin Arbab | $68,832 |
Source: Public Records
Tax History Compared to Growth
Tax History
| Year | Tax Paid | Tax Assessment Tax Assessment Total Assessment is a certain percentage of the fair market value that is determined by local assessors to be the total taxable value of land and additions on the property. | Land | Improvement |
|---|---|---|---|---|
| 2025 | $2,494 | $231,500 | $32,700 | $198,800 |
| 2024 | $2,494 | $168,480 | $27,110 | $141,370 |
| 2023 | $1,258 | $199,700 | $28,100 | $171,600 |
| 2022 | $516 | $155,900 | $22,600 | $133,300 |
| 2021 | $180 | $155,900 | $22,600 | $133,300 |
| 2020 | $182 | $136,500 | $19,800 | $116,700 |
| 2019 | $648 | $136,500 | $19,800 | $116,700 |
| 2018 | $376 | $24,100 | $14,100 | $10,000 |
| 2017 | $344 | $14,100 | $14,100 | $0 |
| 2016 | $1,254 | $12,700 | $12,700 | $0 |
| 2015 | $334 | $12,700 | $12,700 | $0 |
| 2014 | $457 | $12,000 | $12,000 | $0 |
Source: Public Records
Map
Nearby Homes