302 Montclair St Chula Vista, CA 91911
Castle Park NeighborhoodEstimated Value: $729,896 - $881,000
3
Beds
2
Baths
1,032
Sq Ft
$770/Sq Ft
Est. Value
About This Home
This home is located at 302 Montclair St, Chula Vista, CA 91911 and is currently estimated at $794,474, approximately $769 per square foot. 302 Montclair St is a home located in San Diego County with nearby schools including Karl H Kellogg Elementary School, Hilltop Middle School, and Hilltop Senior High School.
Ownership History
Date
Name
Owned For
Owner Type
Purchase Details
Closed on
Aug 21, 2000
Sold by
Odell Magdalena M and Pranger Magdalena M
Bought by
Pranger Thomas L
Current Estimated Value
Home Financials for this Owner
Home Financials are based on the most recent Mortgage that was taken out on this home.
Original Mortgage
$189,000
Outstanding Balance
$63,316
Interest Rate
8.13%
Estimated Equity
$731,158
Purchase Details
Closed on
Aug 16, 2000
Sold by
Pranger Thomas L
Bought by
Goldhagen Paul and Goldhagen Geraldine C
Home Financials for this Owner
Home Financials are based on the most recent Mortgage that was taken out on this home.
Original Mortgage
$189,000
Outstanding Balance
$63,316
Interest Rate
8.13%
Estimated Equity
$731,158
Create a Home Valuation Report for This Property
The Home Valuation Report is an in-depth analysis detailing your home's value as well as a comparison with similar homes in the area
Home Values in the Area
Average Home Value in this Area
Purchase History
| Date | Buyer | Sale Price | Title Company |
|---|---|---|---|
| Pranger Thomas L | -- | Stewart Title Company | |
| Goldhagen Paul | $229,500 | Stewart Title Company |
Source: Public Records
Mortgage History
| Date | Status | Borrower | Loan Amount |
|---|---|---|---|
| Open | Goldhagen Paul | $189,000 |
Source: Public Records
Tax History
| Year | Tax Paid | Tax Assessment Tax Assessment Total Assessment is a certain percentage of the fair market value that is determined by local assessors to be the total taxable value of land and additions on the property. | Land | Improvement |
|---|---|---|---|---|
| 2025 | $3,578 | $316,414 | $120,536 | $195,878 |
| 2024 | $3,578 | $310,211 | $118,173 | $192,038 |
| 2023 | $3,528 | $304,129 | $115,856 | $188,273 |
| 2022 | $3,425 | $298,167 | $113,585 | $184,582 |
| 2021 | $3,345 | $292,321 | $111,358 | $180,963 |
| 2020 | $3,264 | $289,325 | $110,217 | $179,108 |
| 2019 | $3,179 | $283,653 | $108,056 | $175,597 |
| 2018 | $3,128 | $278,092 | $105,938 | $172,154 |
| 2017 | $10 | $272,640 | $103,861 | $168,779 |
| 2016 | $2,988 | $267,295 | $101,825 | $165,470 |
| 2015 | $2,945 | $263,281 | $100,296 | $162,985 |
| 2014 | $2,895 | $258,125 | $98,332 | $159,793 |
Source: Public Records
Map
Nearby Homes
- 953 Maria Way
- 376 Roman Way
- 939 Nolan Way
- 445 Montcalm St
- 902 Monterey Ct
- 476 Montclair St
- 75 E Naples St
- 1267 Melrose Ave
- 1139 Ocelot Ave
- 1054 Cuyamaca Ave
- 161 E Palomar St
- 1324 Park Dr
- 466 Thrush St
- 814 Tamayo Dr Unit 2
- 927 Agua Tibia Ave
- 1268 Helix Ave
- 202 E J St
- 1008 Calma Dr
- 1236 Tobias Dr
- 1408 Oleander Ave
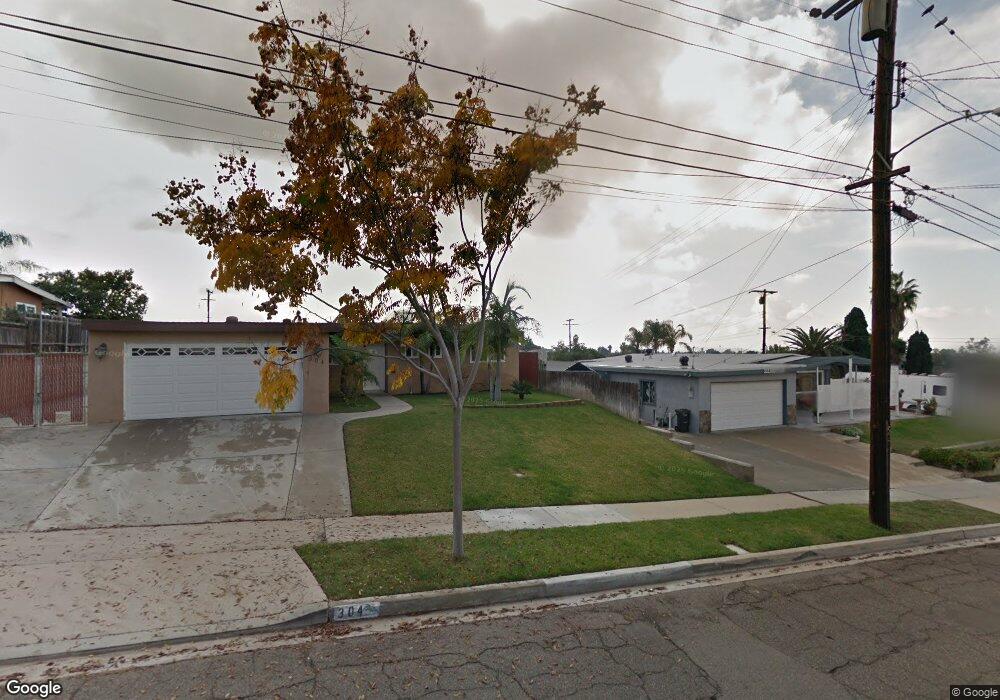
- 304 Montclair St
- 301 Montcalm St
- 305 Montcalm St
- 280 Montclair St
- 314 Montclair St
- 301 Montclair St
- 315 Montcalm St
- 1070 Monterey Ave
- 287 Montclair St
- 305 Montclair St
- 274 Montclair St
- 318 Montclair St
- 315 Montclair St
- 281 Montclair St
- 1076 Monterey Ave
- 319 Montcalm St
- 1035 Monterey Ct
- 319 Montclair St
- 302 Montcalm St
- 275 Montclair St
Your Personal Tour Guide
Ask me questions while you tour the home.