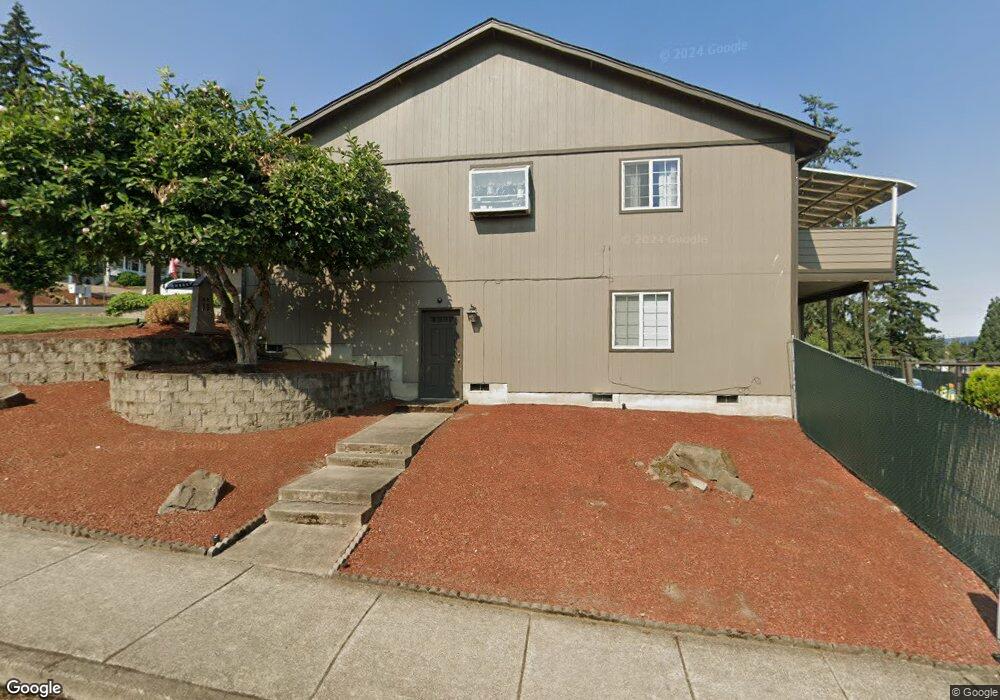
302 S 69th Place Springfield, OR 97478
Thurston NeighborhoodEstimated Value: $402,000 - $433,000
3
Beds
2
Baths
1,478
Sq Ft
$283/Sq Ft
Est. Value
About This Home
This home is located at 302 S 69th Place, Springfield, OR 97478 and is currently estimated at $418,626, approximately $283 per square foot. 302 S 69th Place is a home located in Lane County with nearby schools including Thurston Elementary School, Thurston Middle School, and Thurston High School.
Ownership History
Date
Name
Owned For
Owner Type
Purchase Details
Closed on
Apr 4, 2024
Sold by
Neckels Nathan A and Neckels Jade L
Bought by
Rust Edwin and Rust Susan
Current Estimated Value
Home Financials for this Owner
Home Financials are based on the most recent Mortgage that was taken out on this home.
Original Mortgage
$408,800
Outstanding Balance
$401,959
Interest Rate
6.9%
Mortgage Type
VA
Estimated Equity
$16,667
Purchase Details
Closed on
Oct 17, 2007
Sold by
Campbell Rowland D and Campbell Ruth R
Bought by
Neckels Nathan A and Neckels Jade L
Home Financials for this Owner
Home Financials are based on the most recent Mortgage that was taken out on this home.
Original Mortgage
$226,446
Interest Rate
6.42%
Mortgage Type
FHA
Purchase Details
Closed on
Oct 22, 1997
Sold by
Roner Tommy Jean
Bought by
Campbell Rowland D and Campbell Ruth R
Create a Home Valuation Report for This Property
The Home Valuation Report is an in-depth analysis detailing your home's value as well as a comparison with similar homes in the area
Home Values in the Area
Average Home Value in this Area
Purchase History
| Date | Buyer | Sale Price | Title Company |
|---|---|---|---|
| Rust Edwin | $408,800 | Evergreen Land Title | |
| Neckels Nathan A | $230,000 | Fidelity National Title Insu | |
| Campbell Rowland D | $120,500 | Cascade Title Co |
Source: Public Records
Mortgage History
| Date | Status | Borrower | Loan Amount |
|---|---|---|---|
| Open | Rust Edwin | $408,800 | |
| Previous Owner | Neckels Nathan A | $226,446 |
Source: Public Records
Tax History
| Year | Tax Paid | Tax Assessment Tax Assessment Total Assessment is a certain percentage of the fair market value that is determined by local assessors to be the total taxable value of land and additions on the property. | Land | Improvement |
|---|---|---|---|---|
| 2025 | $4,136 | $225,531 | -- | -- |
| 2024 | $4,069 | $218,963 | -- | -- |
| 2023 | $4,069 | $212,586 | $0 | $0 |
| 2022 | $3,768 | $206,395 | $0 | $0 |
| 2021 | $3,701 | $200,384 | $0 | $0 |
| 2020 | $3,593 | $194,548 | $0 | $0 |
| 2019 | $3,485 | $188,882 | $0 | $0 |
| 2018 | $3,285 | $178,040 | $0 | $0 |
| 2017 | $3,159 | $178,040 | $0 | $0 |
| 2016 | $3,092 | $172,854 | $0 | $0 |
| 2015 | $3,004 | $167,819 | $0 | $0 |
| 2014 | $2,959 | $162,931 | $0 | $0 |
Source: Public Records
Map
Nearby Homes
- 6964 Bluebelle Way
- 246 S 70th St
- 6875 B St
- 0 S 69th Place
- 7027 S E St
- 250 68th St
- 616 S 71st St
- 353 71st St
- 0 71st St
- 6842 Jessica Dr
- 994 S 67th St
- 6884 Forest Ridge Dr
- 6451 Dogwood St
- 6540 B St
- 555 66th St
- 0 Forest Ridge Unit 520732026
- 962 S 66th Place
- 320 Mountaingate Dr
- 982 S 66th Place
- 6445 B St
- 302 S 69th Place
- 308 S 69th Place
- 257 S 69th Place
- 6950 Bluebelle Way
- 269 S 69th Place
- 348 S 69th Place
- 316 S 69th Place
- 250 S 70th St
- 324 S 69th Place
- 281 S 69th Place
- 340 S 69th Place
- 197 S 69th Place
- 354 S 69th Place
- 6976 Bluebelle Way
- 332 S 69th Place
- 6951 Bluebelle Way
- 370 S 69th Place
- 242 S 70th St
- 378 S 69th Place
- 6963 Bluebelle Way
Your Personal Tour Guide
Ask me questions while you tour the home.