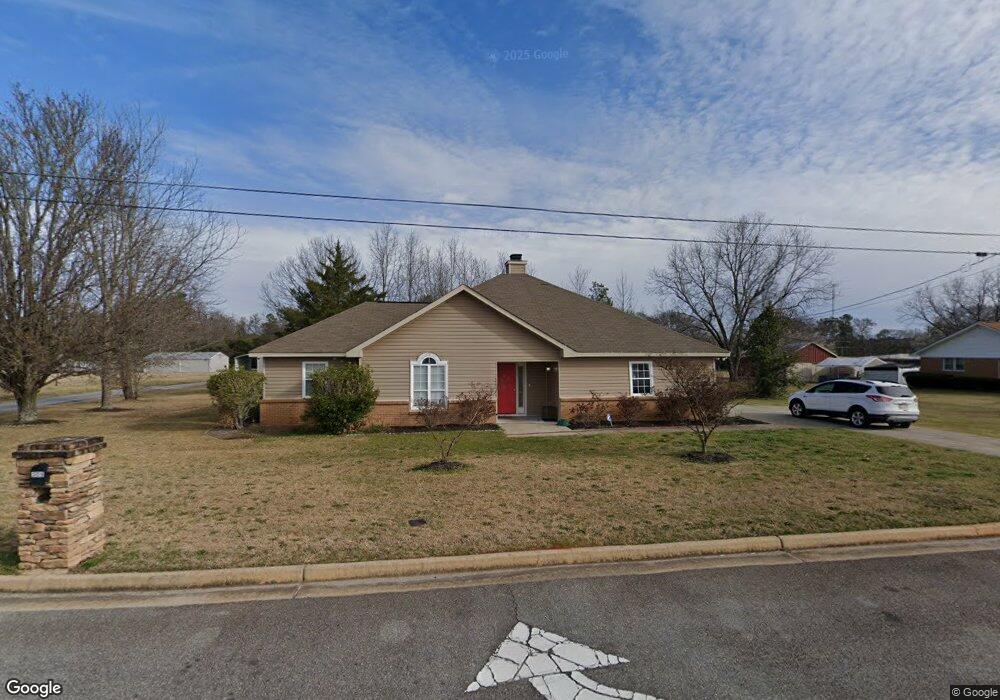
302 Thomson Rd Centerville, GA 31028
Estimated Value: $236,842 - $251,000
3
Beds
2
Baths
1,812
Sq Ft
$133/Sq Ft
Est. Value
About This Home
This home is located at 302 Thomson Rd, Centerville, GA 31028 and is currently estimated at $241,711, approximately $133 per square foot. 302 Thomson Rd is a home located in Houston County with nearby schools including Eagle Springs Elementary School, Thomson Middle School, and Northside High School.
Ownership History
Date
Name
Owned For
Owner Type
Purchase Details
Closed on
Sep 6, 2022
Sold by
Smith Rowena E
Bought by
Merrill Lynch First Franklin Mortgage Loan Tr
Current Estimated Value
Purchase Details
Closed on
Jun 5, 2018
Sold by
Warnock Larry E and Thaxton Kenneth
Bought by
Warnock Larry E
Purchase Details
Closed on
Jan 10, 2014
Sold by
Warnock Larry
Bought by
Thaxton Kenneth and Thaxton Deana
Purchase Details
Closed on
Dec 31, 2004
Sold by
Wood Thomas A and Wood Frankie S
Bought by
Warnock Larry
Purchase Details
Closed on
Apr 12, 1995
Sold by
Brown Terry G
Bought by
Wood Thomas A and Wood Frankie S
Purchase Details
Closed on
Jun 29, 1988
Sold by
Joyner James H and Joyner Diane P
Bought by
Brown Terry G
Purchase Details
Closed on
Mar 22, 1988
Sold by
Joyner James H and Joyner Diane P
Bought by
Brown Terry G
Create a Home Valuation Report for This Property
The Home Valuation Report is an in-depth analysis detailing your home's value as well as a comparison with similar homes in the area
Home Values in the Area
Average Home Value in this Area
Purchase History
| Date | Buyer | Sale Price | Title Company |
|---|---|---|---|
| Merrill Lynch First Franklin Mortgage Loan Tr | -- | -- | |
| Merrill Lynch First Franklin Mortgage Loan Tr | -- | None Listed On Document | |
| Warnock Larry E | $307,682 | None Available | |
| Thaxton Kenneth | $390,000 | -- | |
| Warnock Larry | $125,000 | -- | |
| Wood Thomas A | $91,000 | -- | |
| Brown Terry G | $6,000 | -- | |
| Brown Terry G | $6,000 | -- |
Source: Public Records
Tax History
| Year | Tax Paid | Tax Assessment Tax Assessment Total Assessment is a certain percentage of the fair market value that is determined by local assessors to be the total taxable value of land and additions on the property. | Land | Improvement |
|---|---|---|---|---|
| 2025 | $2,087 | $71,800 | $8,800 | $63,000 |
| 2024 | $2,296 | $66,200 | $6,800 | $59,400 |
| 2023 | $1,966 | $56,280 | $4,800 | $51,480 |
| 2022 | $1,163 | $50,600 | $4,800 | $45,800 |
| 2021 | $1,062 | $45,920 | $4,800 | $41,120 |
| 2020 | $1,058 | $45,560 | $4,800 | $40,760 |
| 2019 | $1,058 | $45,560 | $4,800 | $40,760 |
| 2018 | $1,058 | $45,560 | $4,800 | $40,760 |
| 2017 | $1,060 | $45,560 | $4,800 | $40,760 |
| 2016 | $1,063 | $45,560 | $4,800 | $40,760 |
| 2015 | $1,063 | $45,560 | $4,800 | $40,760 |
| 2014 | -- | $45,560 | $4,800 | $40,760 |
| 2013 | -- | $45,560 | $6,000 | $39,560 |
Source: Public Records
Map
Nearby Homes
- 306 Thomson St
- 132 Montrose Ln
- 209 Trellis Walk
- 805 N Houston Lake Blvd
- 115 Montrose Ln
- 107 Miller Ct
- 304 Montview Way
- 111 Montrose Ln
- 816 B N Houston Lake Blvd
- 102 Lee St Unit 117 Wilson Drive
- 102 Lee St
- 110 Lee St
- 111 Shamrock Dr
- 222 Ridgewood Dr
- 400 S Cambridge Dr
- 116 Tivoli Park Rd
- 509 Saint Marlo Dr
- 204 S Cambridge Dr
- 118 Ridgewood Dr
- 104 Orchard Ln
- 396 Thomson St
- 300 Thomson St
- 398 Thomson Rd
- 104 Spring Valley Dr
- 111 Pine Terrace
- 250 Thomson St
- 213 Harold Dr
- 108 Spring Valley Dr
- 401 Thomson Rd
- 400 Thomson Rd
- 100 Spring Valley Dr
- 218 Thomson St
- 211 Harold Dr
- 110 Spring Valley Dr
- 210 Harold Dr
- 212 Harold Dr
- 212 Harold Dr
- 109 Spring Valley Dr
- 113 Spring Valley Dr
- 101 Ginny Dr
Your Personal Tour Guide
Ask me questions while you tour the home.