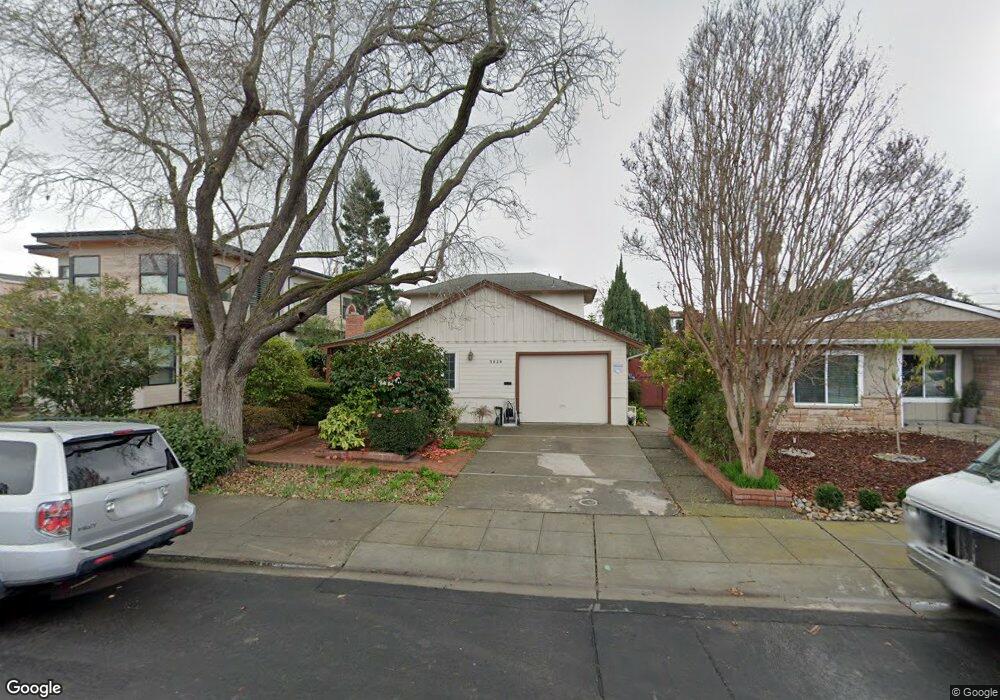
3020 South Ct Palo Alto, CA 94306
Midtown Palo Alto NeighborhoodEstimated Value: $3,275,087 - $3,952,000
3
Beds
2
Baths
1,816
Sq Ft
$2,029/Sq Ft
Est. Value
About This Home
This home is located at 3020 South Ct, Palo Alto, CA 94306 and is currently estimated at $3,684,772, approximately $2,029 per square foot. 3020 South Ct is a home located in Santa Clara County with nearby schools including El Carmelo Elementary School, Jane Lathrop Stanford Middle School, and Henry M. Gunn High School.
Ownership History
Date
Name
Owned For
Owner Type
Purchase Details
Closed on
Mar 3, 2000
Sold by
Scharman Leon And Jessie A Trustee
Bought by
Shen Jun and Wang Lingli
Current Estimated Value
Home Financials for this Owner
Home Financials are based on the most recent Mortgage that was taken out on this home.
Original Mortgage
$742,500
Outstanding Balance
$174,053
Interest Rate
3.95%
Estimated Equity
$3,510,719
Create a Home Valuation Report for This Property
The Home Valuation Report is an in-depth analysis detailing your home's value as well as a comparison with similar homes in the area
Home Values in the Area
Average Home Value in this Area
Purchase History
| Date | Buyer | Sale Price | Title Company |
|---|---|---|---|
| Shen Jun | $990,000 | Financial Title Company |
Source: Public Records
Mortgage History
| Date | Status | Borrower | Loan Amount |
|---|---|---|---|
| Open | Shen Jun | $742,500 |
Source: Public Records
Tax History Compared to Growth
Tax History
| Year | Tax Paid | Tax Assessment Tax Assessment Total Assessment is a certain percentage of the fair market value that is determined by local assessors to be the total taxable value of land and additions on the property. | Land | Improvement |
|---|---|---|---|---|
| 2025 | $18,455 | $1,521,598 | $760,799 | $760,799 |
| 2024 | $18,455 | $1,491,764 | $745,882 | $745,882 |
| 2023 | $18,180 | $1,462,514 | $731,257 | $731,257 |
| 2022 | $17,964 | $1,433,838 | $716,919 | $716,919 |
| 2021 | $17,608 | $1,405,724 | $702,862 | $702,862 |
| 2020 | $17,252 | $1,391,312 | $695,656 | $695,656 |
| 2019 | $17,058 | $1,364,032 | $682,016 | $682,016 |
| 2018 | $16,597 | $1,337,288 | $668,644 | $668,644 |
| 2017 | $16,304 | $1,311,068 | $655,534 | $655,534 |
| 2016 | $15,873 | $1,285,362 | $642,681 | $642,681 |
| 2015 | $15,714 | $1,266,056 | $633,028 | $633,028 |
| 2014 | $15,354 | $1,241,256 | $620,628 | $620,628 |
Source: Public Records
Map
Nearby Homes
- 339 El Verano Ave
- 3213 Alma St
- 2685 Cowper St
- 2760 Byron St
- 360 Fernando Ave
- 151 Colorado Ave
- 2590 Webster St
- 3585 El Camino Real
- 3 Plan at Acacia
- 2A Plan at Acacia
- 1 Plan at Acacia
- 5 Plan at Acacia
- 4X Plan at Acacia
- 2 Plan at Acacia
- 4 Plan at Acacia
- 3428 Alma Village Cir
- 590 Ashton Ave
- 200 Sheridan Ave Unit 303
- 200 Sheridan Ave Unit 304
- 200 Sheridan Ave Unit 103