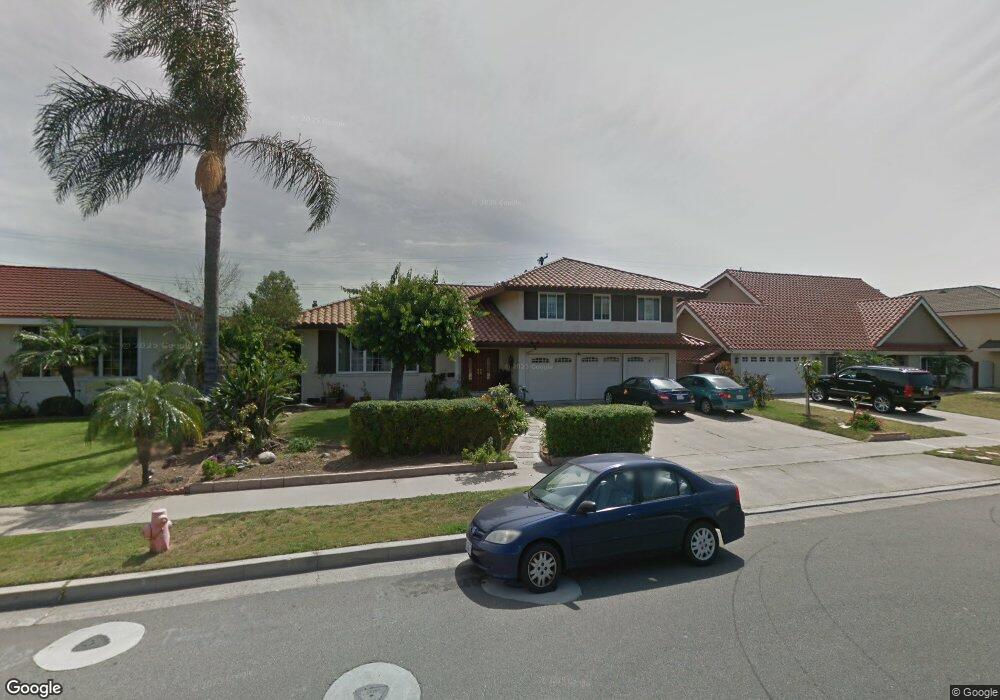
3022 E Palmyra Ave Orange, CA 92869
Estimated Value: $1,234,000 - $1,449,874
5
Beds
3
Baths
2,735
Sq Ft
$486/Sq Ft
Est. Value
About This Home
This home is located at 3022 E Palmyra Ave, Orange, CA 92869 and is currently estimated at $1,329,719, approximately $486 per square foot. 3022 E Palmyra Ave is a home located in Orange County with nearby schools including La Veta Elementary School, El Modena High School, and Spirit Christian Academy.
Ownership History
Date
Name
Owned For
Owner Type
Purchase Details
Closed on
Mar 2, 2021
Sold by
Bystry Phil and Bystry Wanette
Bought by
Phanslo Trust and Bystry
Current Estimated Value
Purchase Details
Closed on
Oct 26, 1995
Sold by
Bystry Phil and Bystry Wanette
Bought by
Bystry Phil and Bystry Wanette
Home Financials for this Owner
Home Financials are based on the most recent Mortgage that was taken out on this home.
Original Mortgage
$203,150
Interest Rate
7.58%
Purchase Details
Closed on
Aug 8, 1994
Sold by
Robertson Bryce F and Robertson Marlene D
Bought by
Bystry Phil and Bystry Wanette
Home Financials for this Owner
Home Financials are based on the most recent Mortgage that was taken out on this home.
Original Mortgage
$219,600
Interest Rate
8.5%
Create a Home Valuation Report for This Property
The Home Valuation Report is an in-depth analysis detailing your home's value as well as a comparison with similar homes in the area
Home Values in the Area
Average Home Value in this Area
Purchase History
| Date | Buyer | Sale Price | Title Company |
|---|---|---|---|
| Phanslo Trust | -- | Raymond Phillip | |
| Bystry Phil | -- | Gateway Title Company | |
| Bystry Phil | $244,000 | First American Title Ins Co |
Source: Public Records
Mortgage History
| Date | Status | Borrower | Loan Amount |
|---|---|---|---|
| Previous Owner | Bystry Phil | $203,150 | |
| Previous Owner | Bystry Phil | $219,600 |
Source: Public Records
Tax History
| Year | Tax Paid | Tax Assessment Tax Assessment Total Assessment is a certain percentage of the fair market value that is determined by local assessors to be the total taxable value of land and additions on the property. | Land | Improvement |
|---|---|---|---|---|
| 2025 | $4,551 | $408,334 | $197,563 | $210,771 |
| 2024 | $4,551 | $400,328 | $193,689 | $206,639 |
| 2023 | $4,447 | $392,479 | $189,891 | $202,588 |
| 2022 | $4,358 | $384,784 | $186,168 | $198,616 |
| 2021 | $4,238 | $377,240 | $182,518 | $194,722 |
| 2020 | $4,198 | $373,372 | $180,646 | $192,726 |
| 2019 | $4,145 | $366,051 | $177,103 | $188,948 |
| 2018 | $4,081 | $358,874 | $173,630 | $185,244 |
| 2017 | $3,914 | $351,838 | $170,226 | $181,612 |
| 2016 | $3,838 | $344,940 | $166,889 | $178,051 |
| 2015 | $3,781 | $339,759 | $164,382 | $175,377 |
| 2014 | $3,699 | $333,104 | $161,162 | $171,942 |
Source: Public Records
Map
Nearby Homes
- 244 S Violet Ln
- 466 S Wellington Rd
- 3030 E Elgin Place
- 3139 E Chapman Ave Unit 3B
- 338 S James St
- 547 S Yorba St
- 629 S Yorba St
- 369 S Jennifer Ln
- 17922 Romelle Ave
- 3406 E Lochleven Ln Unit B
- 448 N Londonderry Ln Unit D
- 279 N Sacramento St
- 2720 E Walnut Ave Unit 73
- 3801 E Spring St
- 4223 E Marmon Ave
- 840 S Yorba St
- 762 S Breezy Way
- 4008 E Fernwood Ave
- 478 N Swidler St
- 3527 E Barrington Dr
- 3032 E Palmyra Ave
- 3010 E Palmyra Ave
- 3015 E Roberta Dr
- 3003 E Roberta Dr
- 3035 E Roberta Dr
- 3044 E Palmyra Ave
- 2946 E Palmyra Ave
- 2937 E Roberta Dr
- 3005 E Palmyra Ave
- 295 S Kathleen Ln
- 2945 E Palmyra Ave
- 3037 E Roberta Dr
- 2940 E Palmyra Ave
- 306 S Violet Ln
- 2927 E Roberta Dr
- 283 S Kathleen Ln
- 3018 E Roberta Dr
- 278 S Kathleen Ln
- 288 S Violet Ln
- 291 S Craig Dr
Your Personal Tour Guide
Ask me questions while you tour the home.