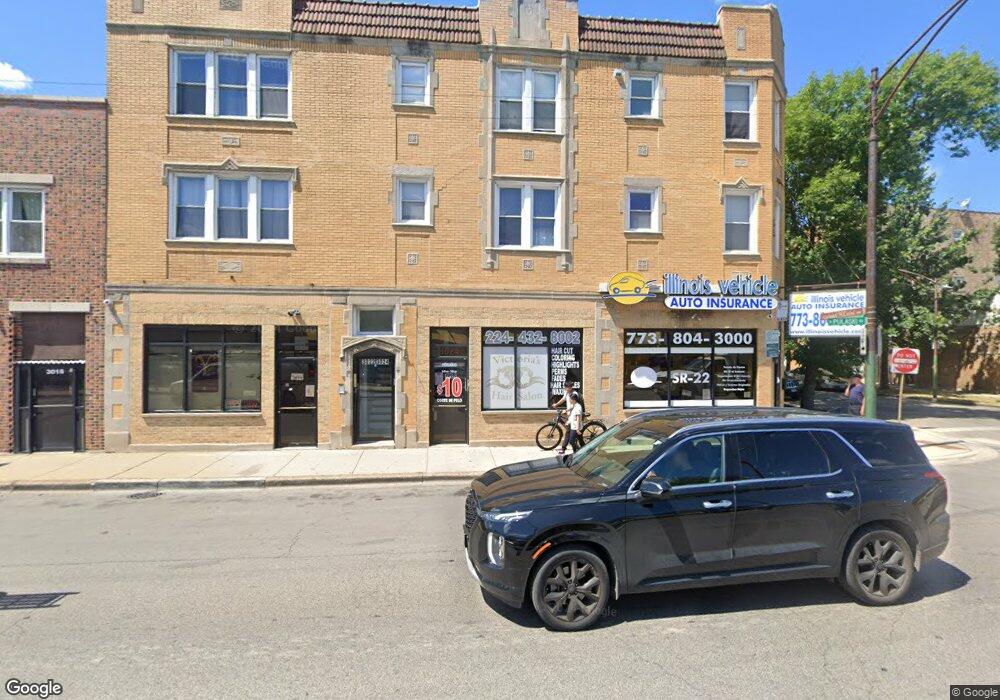
3022 N Pulaski Rd Unit 5A Chicago, IL 60641
Avondale NeighborhoodEstimated Value: $170,000 - $176,329
1
Bed
1
Bath
700
Sq Ft
$249/Sq Ft
Est. Value
About This Home
This home is located at 3022 N Pulaski Rd Unit 5A, Chicago, IL 60641 and is currently estimated at $174,332, approximately $249 per square foot. 3022 N Pulaski Rd Unit 5A is a home located in Cook County with nearby schools including Garcia Lorca Elementary School, Schurz High School, and ASPIRA Early College High School.
Ownership History
Date
Name
Owned For
Owner Type
Purchase Details
Closed on
Mar 4, 2025
Sold by
Occira Group Llc Lakeshore Series
Bought by
Gohacki Garrett
Current Estimated Value
Home Financials for this Owner
Home Financials are based on the most recent Mortgage that was taken out on this home.
Original Mortgage
$146,400
Outstanding Balance
$145,031
Interest Rate
5.88%
Mortgage Type
New Conventional
Estimated Equity
$29,301
Purchase Details
Closed on
Jan 3, 2019
Sold by
Goodwin Luke and Clements Mitch
Bought by
Occira Group Llc
Purchase Details
Closed on
Oct 26, 2012
Sold by
Jpmorgan Chase Bank Na
Bought by
Goodwin Luke and Clements Mitch
Purchase Details
Closed on
Jan 27, 2005
Sold by
3022-24 North Pulaski Llc
Bought by
Wysocka Ewa
Home Financials for this Owner
Home Financials are based on the most recent Mortgage that was taken out on this home.
Original Mortgage
$131,900
Interest Rate
5.79%
Mortgage Type
Purchase Money Mortgage
Create a Home Valuation Report for This Property
The Home Valuation Report is an in-depth analysis detailing your home's value as well as a comparison with similar homes in the area
Home Values in the Area
Average Home Value in this Area
Purchase History
| Date | Buyer | Sale Price | Title Company |
|---|---|---|---|
| Gohacki Garrett | $172,000 | First American Title | |
| Occira Group Llc | $90,000 | Attorney | |
| Goodwin Luke | $35,000 | None Available | |
| Wysocka Ewa | $132,000 | Rtc |
Source: Public Records
Mortgage History
| Date | Status | Borrower | Loan Amount |
|---|---|---|---|
| Open | Gohacki Garrett | $146,400 | |
| Previous Owner | Wysocka Ewa | $131,900 |
Source: Public Records
Tax History
| Year | Tax Paid | Tax Assessment Tax Assessment Total Assessment is a certain percentage of the fair market value that is determined by local assessors to be the total taxable value of land and additions on the property. | Land | Improvement |
|---|---|---|---|---|
| 2025 | $1,694 | $15,200 | $1,253 | $13,947 |
| 2024 | $1,694 | $15,200 | $1,253 | $13,947 |
| 2023 | $1,651 | $8,000 | $1,010 | $6,990 |
| 2022 | $1,651 | $8,000 | $1,010 | $6,990 |
| 2021 | $1,614 | $7,999 | $1,010 | $6,989 |
| 2020 | $1,669 | $7,466 | $586 | $6,880 |
| 2019 | $1,694 | $8,400 | $586 | $7,814 |
| 2018 | $2,183 | $11,052 | $586 | $10,466 |
| 2017 | $2,130 | $9,894 | $525 | $9,369 |
| 2016 | $1,982 | $9,894 | $525 | $9,369 |
| 2015 | $1,813 | $9,894 | $525 | $9,369 |
| 2014 | $2,044 | $11,019 | $485 | $10,534 |
| 2013 | $1,526 | $11,019 | $485 | $10,534 |
Source: Public Records
Map
Nearby Homes
- 3024 N Pulaski Rd Unit 4B
- 3975 W Barry Ave
- 4045 W Nelson St
- 4055 W Nelson St
- 3041 N Davlin Ct
- 3117 N Karlov Ave
- 2941 N Harding Ave
- 3963 W Belmont Ave Unit 322
- 3963 W Belmont Ave Unit 217
- 3039 N Haussen Ct
- 3078 N Haussen Ct
- 4131 W Belmont Ave Unit 402
- 3278 N Milwaukee Ave
- 4200 W Belmont Ave
- 4202 W Belmont Ave
- 4210 W Belmont Ave Unit 3
- 4214 W Belmont Ave Unit 5
- 3206 N Keeler Ave
- 3210 N Keeler Ave
- 3101 N Ridgeway Ave Unit 4D
- 3022 N Pulaski Rd Unit 7A
- 3022 N Pulaski Rd Unit 3C
- 3022 N Pulaski Rd Unit 1C
- 3022 N Pulaski Rd Unit 2C
- 3022 N Pulaski Rd Unit 1B
- 3022 N Pulaski Rd Unit 3A
- 3022 N Pulaski Rd Unit 5C
- 3022 N Pulaski Rd Unit 4B
- 3022 N Pulaski Rd Unit 4C
- 3022 N Pulaski Rd Unit 2B
- 3022 N Pulaski Rd Unit 9B
- 3022 N Pulaski Rd Unit 3B
- 3022 N Pulaski Rd Unit 5B
- 4009 W Nelson St Unit 9A
- 4009 W Nelson St Unit 9C
- 4009 W Nelson St Unit 9B
- 4005 W Nelson St Unit 5A
- 4005 W Nelson St Unit 5C
- 4005 W Nelson St Unit 5B
- 4007 W Nelson St Unit 7B
Your Personal Tour Guide
Ask me questions while you tour the home.