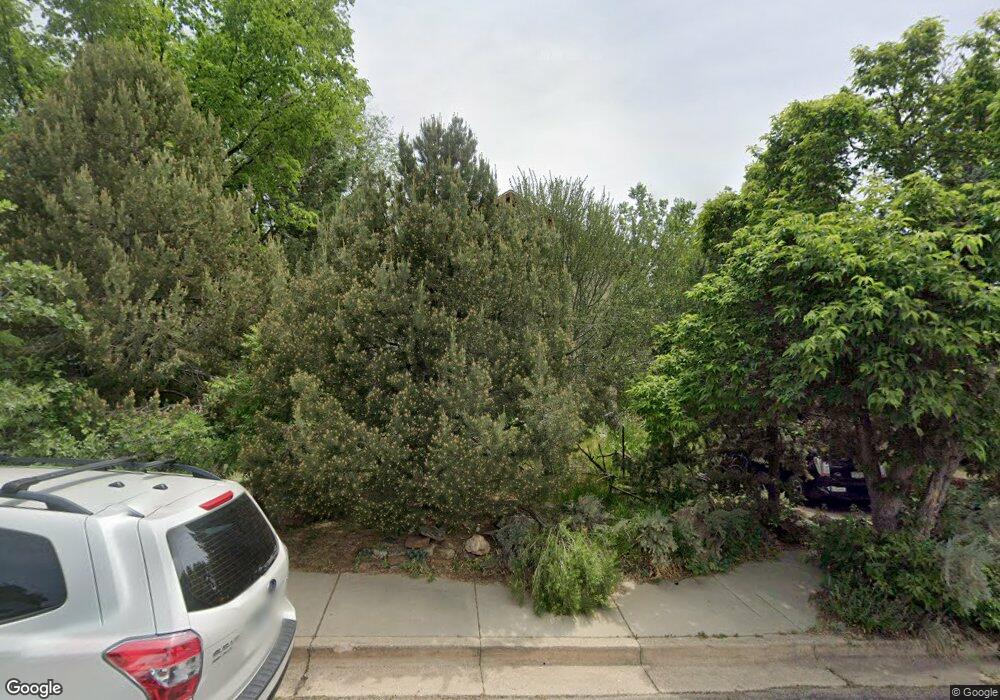
3024 5th St Boulder, CO 80304
Newlands NeighborhoodEstimated Value: $1,756,038 - $2,459,000
3
Beds
2
Baths
2,035
Sq Ft
$976/Sq Ft
Est. Value
About This Home
This home is located at 3024 5th St, Boulder, CO 80304 and is currently estimated at $1,985,510, approximately $975 per square foot. 3024 5th St is a home located in Boulder County with nearby schools including Foothill Elementary School, Casey Middle School, and Boulder High School.
Ownership History
Date
Name
Owned For
Owner Type
Purchase Details
Closed on
Mar 19, 2007
Sold by
Schmidt Steven K
Bought by
Schmidt Steven K
Current Estimated Value
Purchase Details
Closed on
May 31, 1988
Bought by
Schmidt Steven K and Schmidt Merrit C
Purchase Details
Closed on
Jun 28, 1985
Bought by
Schmidt Steven K and Schmidt Merrit C
Purchase Details
Closed on
Feb 10, 1982
Bought by
Schmidt Steven K and Schmidt Merrit C
Purchase Details
Closed on
Feb 2, 1956
Bought by
Schmidt Steven K and Schmidt Merrit C
Create a Home Valuation Report for This Property
The Home Valuation Report is an in-depth analysis detailing your home's value as well as a comparison with similar homes in the area
Home Values in the Area
Average Home Value in this Area
Purchase History
We collect this data history from publicly available records. To have your information removed, we recommend requesting removal directly through your county’s website.
| Date | Buyer | Sale Price | Title Company |
|---|---|---|---|
| Schmidt Steven K | -- | None Available | |
| Schmidt Steven K | $99,000 | -- | |
| Schmidt Steven K | $89,500 | -- | |
| Schmidt Steven K | $78,000 | -- | |
| Schmidt Steven K | $12,600 | -- |
Source: Public Records
Tax History
| Year | Tax Paid | Tax Assessment Tax Assessment Total Assessment is a certain percentage of the fair market value that is determined by local assessors to be the total taxable value of land and additions on the property. | Land | Improvement |
|---|---|---|---|---|
| 2025 | $11,273 | $135,435 | $105,223 | $30,212 |
| 2024 | $10,888 | $124,482 | $96,713 | $27,769 |
| 2023 | $10,699 | $130,590 | $107,187 | $27,088 |
| 2022 | $8,985 | $103,708 | $76,978 | $26,730 |
| 2021 | $9,184 | $106,692 | $79,193 | $27,499 |
| 2020 | $8,301 | $95,360 | $70,142 | $25,218 |
| 2019 | $8,174 | $95,360 | $70,142 | $25,218 |
| 2018 | $7,096 | $81,850 | $56,304 | $25,546 |
| 2017 | $6,874 | $90,489 | $62,247 | $28,242 |
| 2016 | $6,649 | $76,814 | $46,725 | $30,089 |
| 2015 | $6,297 | $63,966 | $27,780 | $36,186 |
| 2014 | $5,378 | $63,966 | $27,780 | $36,186 |
Source: Public Records
Map
Nearby Homes
- 2958 6th St
- 675 Dellwood Ave
- 501 Evergreen Ave
- 315 Evergreen Ave
- 3033 3rd St
- 3015 3rd St
- 3123 3rd St
- 300 Forest Ave
- 515 Alpine Ave
- 3181 9th St
- 815 Alpine Ave Unit 2
- 507 Valley View Dr
- 2675 Dakota Place Unit Newlands
- 2915 11th St
- 3135 11th St
- 810 Alpine Ave
- 521 Hawthorn Ave
- 503 Hawthorn Ave
- 1175 Evergreen Ave
- 640 Iris Ave
Your Personal Tour Guide
Ask me questions while you tour the home.