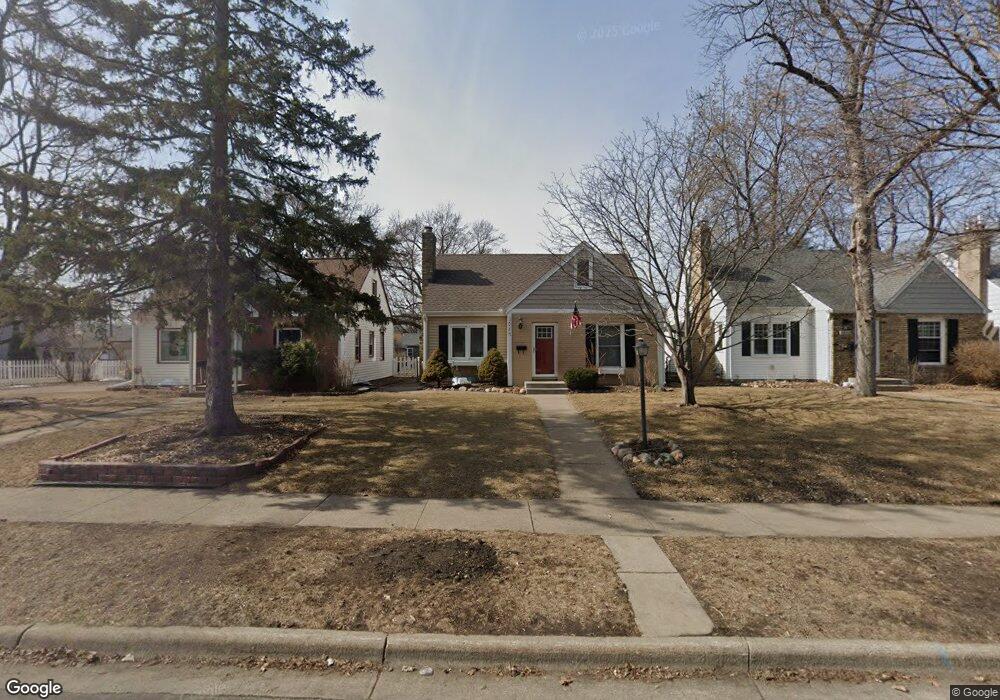
3024 Jersey Ave S Saint Louis Park, MN 55426
Lenox NeighborhoodEstimated Value: $376,509 - $435,000
3
Beds
1
Bath
1,690
Sq Ft
$242/Sq Ft
Est. Value
About This Home
This home is located at 3024 Jersey Ave S, Saint Louis Park, MN 55426 and is currently estimated at $409,127, approximately $242 per square foot. 3024 Jersey Ave S is a home located in Hennepin County with nearby schools including Peter Hobart Elementary School, St. Louis Park Middle School, and St. Louis Park High School.
Ownership History
Date
Name
Owned For
Owner Type
Purchase Details
Closed on
Apr 20, 2018
Sold by
Smith Amanda J and Blasdel Amanda J
Bought by
Smith Todd R and Smith Amanda J
Current Estimated Value
Purchase Details
Closed on
Sep 14, 2012
Sold by
Wolf Steven R
Bought by
Blasdel Amanda J
Home Financials for this Owner
Home Financials are based on the most recent Mortgage that was taken out on this home.
Original Mortgage
$187,920
Outstanding Balance
$130,033
Interest Rate
3.57%
Mortgage Type
New Conventional
Estimated Equity
$279,094
Purchase Details
Closed on
Mar 31, 2006
Sold by
Brown Peter L
Bought by
Wolf Steven R and Braun Katherine M
Purchase Details
Closed on
Nov 25, 2002
Sold by
Wong Ee Chian
Bought by
Brown Peter L
Purchase Details
Closed on
Sep 21, 2001
Sold by
Schmidt Paul
Bought by
Wong Ee Chian
Purchase Details
Closed on
Aug 24, 1999
Sold by
Azar Sandra
Bought by
Schmidt Paul
Purchase Details
Closed on
Aug 13, 1996
Sold by
Medrano Brian S
Bought by
Sandra Azar
Create a Home Valuation Report for This Property
The Home Valuation Report is an in-depth analysis detailing your home's value as well as a comparison with similar homes in the area
Home Values in the Area
Average Home Value in this Area
Purchase History
| Date | Buyer | Sale Price | Title Company |
|---|---|---|---|
| Smith Todd R | -- | None Available | |
| Blasdel Amanda J | $234,900 | Burnet Title | |
| Wolf Steven R | $242,900 | -- | |
| Brown Peter L | $195,000 | -- | |
| Wong Ee Chian | $195,500 | -- | |
| Schmidt Paul | $140,000 | -- | |
| Sandra Azar | $95,500 | -- |
Source: Public Records
Mortgage History
| Date | Status | Borrower | Loan Amount |
|---|---|---|---|
| Open | Blasdel Amanda J | $187,920 |
Source: Public Records
Tax History Compared to Growth
Tax History
| Year | Tax Paid | Tax Assessment Tax Assessment Total Assessment is a certain percentage of the fair market value that is determined by local assessors to be the total taxable value of land and additions on the property. | Land | Improvement |
|---|---|---|---|---|
| 2024 | $5,004 | $368,600 | $126,100 | $242,500 |
| 2023 | $4,973 | $376,200 | $126,100 | $250,100 |
| 2022 | $4,486 | $375,600 | $125,500 | $250,100 |
| 2021 | $4,014 | $340,800 | $109,200 | $231,600 |
| 2020 | $4,174 | $310,800 | $104,000 | $206,800 |
| 2019 | $3,904 | $310,100 | $99,100 | $211,000 |
| 2018 | $3,777 | $282,800 | $94,400 | $188,400 |
| 2017 | $3,640 | $264,600 | $74,700 | $189,900 |
| 2016 | $3,389 | $240,400 | $67,500 | $172,900 |
| 2015 | $3,368 | $232,700 | $63,100 | $169,600 |
| 2014 | -- | $213,400 | $59,900 | $153,500 |
Source: Public Records
Map
Nearby Homes
- 7217 Minnetonka Blvd
- 3124 Maryland Ave S
- 3101 Nevada Ave S
- 2849 Jersey Ave S
- 3216 Kentucky Ave S
- 3149 Nevada Ave S
- 3153 Nevada Ave S
- 2852 Hampshire Ave S
- 2925 Georgia Ave S
- 3056 Florida Ave S
- 3131 Georgia Ave S
- 3267 Library Ln
- 2910 Edgewood Ave S
- 2732 Idaho Ave S
- 3200 Edgewood Ave S
- 3320 Louisiana Ave S Unit 311
- 3320 Louisiana Ave S Unit 410
- 3320 Louisiana Ave S Unit 310
- 3320 Louisiana Ave S Unit 112
- 3300 Louisiana Ave S Unit 517
- 3020 Jersey Ave S
- 3028 Jersey Ave S
- 3016 Jersey Ave S
- 3025 3025 Jersey-Avenue-s
- 3024 3024 Jersey-Avenue-s
- 3020 3020 Jersey Ave S
- 3021 3021 Jersey Ave S
- 3036 Jersey Ave S
- 3033 3033 Jersey-Avenue-s
- 3025 Kentucky Ave S
- 3029 Kentucky Ave S
- 3021 Kentucky Ave S
- 3040 Jersey Ave S
- 3033 Kentucky Ave S
- 3029 Kentucky Ave S
- 3037 Kentucky Ave S
- 3025 Jersey Ave S
- 3021 Jersey Ave S
- 3029 Jersey Ave S
- 7001 Minnetonka Blvd