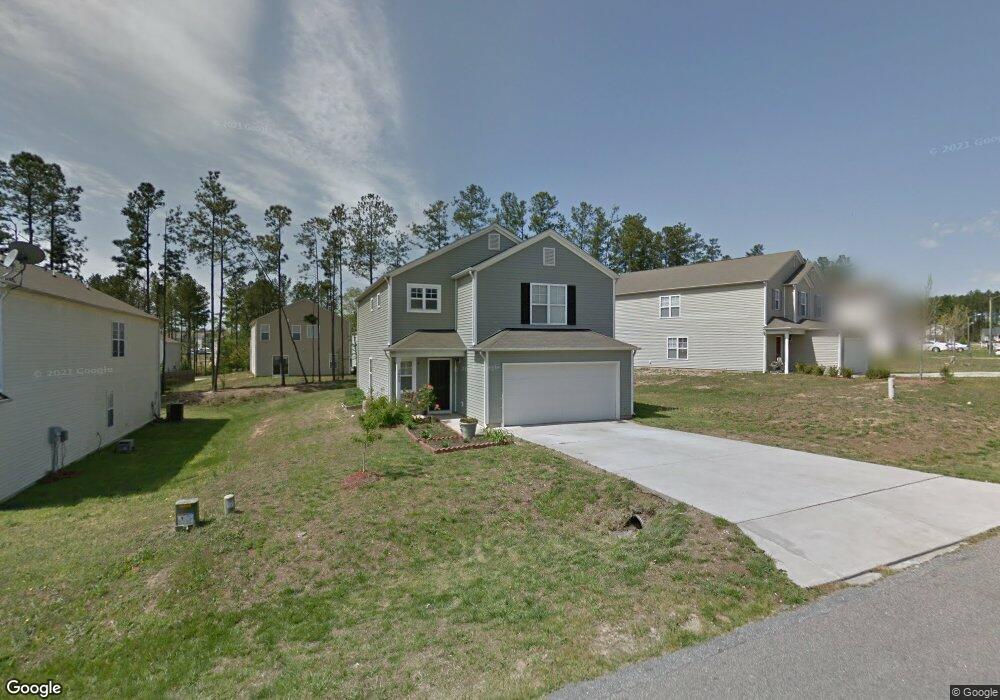
3025 Van Dorn Rd Knightdale, NC 27545
Shotwell NeighborhoodEstimated Value: $342,000 - $349,000
4
Beds
3
Baths
2,121
Sq Ft
$163/Sq Ft
Est. Value
About This Home
This home is located at 3025 Van Dorn Rd, Knightdale, NC 27545 and is currently estimated at $345,488, approximately $162 per square foot. 3025 Van Dorn Rd is a home located in Wake County with nearby schools including Knightdale Elementary School, Neuse River Middle School, and Knightdale High.
Ownership History
Date
Name
Owned For
Owner Type
Purchase Details
Closed on
Oct 4, 2018
Sold by
Progress Residential Borrower 5 Llc
Bought by
Progress Residential Borrowr 5 Llc
Current Estimated Value
Purchase Details
Closed on
Oct 13, 2015
Sold by
Dacosta John A and Dacosta Nabela M
Bought by
Freo North Carolina Llc
Purchase Details
Closed on
Sep 28, 2006
Sold by
Centex Homes
Bought by
Dacosta John A and Dacosta Nabela M
Home Financials for this Owner
Home Financials are based on the most recent Mortgage that was taken out on this home.
Original Mortgage
$125,280
Interest Rate
6.48%
Mortgage Type
Purchase Money Mortgage
Purchase Details
Closed on
May 27, 2005
Sold by
Eastwind Development Llc
Bought by
Centex Homes
Create a Home Valuation Report for This Property
The Home Valuation Report is an in-depth analysis detailing your home's value as well as a comparison with similar homes in the area
Home Values in the Area
Average Home Value in this Area
Purchase History
| Date | Buyer | Sale Price | Title Company |
|---|---|---|---|
| Progress Residential Borrowr 5 Llc | -- | Os National Llc | |
| Freo North Carolina Llc | $169,000 | Attorney | |
| Dacosta John A | $157,000 | None Available | |
| Centex Homes | $1,640,000 | -- |
Source: Public Records
Mortgage History
| Date | Status | Borrower | Loan Amount |
|---|---|---|---|
| Previous Owner | Dacosta John A | $125,280 | |
| Previous Owner | Dacosta John A | $31,320 |
Source: Public Records
Tax History Compared to Growth
Tax History
| Year | Tax Paid | Tax Assessment Tax Assessment Total Assessment is a certain percentage of the fair market value that is determined by local assessors to be the total taxable value of land and additions on the property. | Land | Improvement |
|---|---|---|---|---|
| 2025 | $2,329 | $360,962 | $70,000 | $290,962 |
| 2024 | $2,262 | $360,962 | $70,000 | $290,962 |
| 2023 | $1,817 | $230,432 | $40,000 | $190,432 |
| 2022 | $1,684 | $230,432 | $40,000 | $190,432 |
| 2021 | $1,639 | $230,432 | $40,000 | $190,432 |
| 2020 | $1,612 | $230,432 | $40,000 | $190,432 |
| 2019 | $1,379 | $166,387 | $30,000 | $136,387 |
| 2018 | $1,269 | $166,387 | $30,000 | $136,387 |
| 2017 | $1,203 | $166,387 | $30,000 | $136,387 |
| 2016 | $1,179 | $166,387 | $30,000 | $136,387 |
| 2015 | $1,220 | $172,849 | $30,000 | $142,849 |
| 2014 | $1,157 | $172,849 | $30,000 | $142,849 |
Source: Public Records
Map
Nearby Homes
- 3061 Van Dorn Rd
- 520 Folk Song Way
- 2201 Ballston Place
- 532 Frampton Way
- 1112 Amber Acres Ln
- 1132 Amber Acres Ln
- 1172 Cottonsprings Dr
- 1156 Cottonsprings Dr
- Park Ave Plan at Wendell Falls - Townhome Collection
- Manhattan Plan at Wendell Falls - Townhome Collection
- Greenwich Plan at Wendell Falls - Townhome Collection
- Lincoln Plan at Wendell Falls - Townhome Collection
- Scissors Plan at Wendell Falls - Roshambo Collection
- Found a Dream Plan at Wendell Falls - Playlist Collection
- Paper Plan at Wendell Falls - Roshambo Collection
- Shoot Plan at Wendell Falls - Roshambo Collection
- Southbound Train Plan at Wendell Falls - Playlist Collection
- Castle in Brooklyn Plan at Wendell Falls - Playlist Collection
- Tiebreaker Plan at Wendell Falls - Roshambo Collection
- Rock Plan at Wendell Falls - Roshambo Collection
- 3033 Van Dorn Rd
- 3021 Van Dorn Rd
- 2245 Ballston Place
- 2241 Ballston Place
- 3037 Van Dorn Rd
- 3017 Van Dorn Rd
- 2249 Ballston Place
- 3024 Van Dorn Rd
- 3028 Van Dorn Rd
- 2237 Ballston Place
- 3032 Van Dorn Rd
- 3020 Van Dorn Rd
- 2253 Ballston Place
- 3041 Van Dorn Rd
- 3013 Van Dorn Rd
- 3036 Van Dorn Rd
- 3016 Van Dorn Rd
- 2233 Ballston Place
- 3040 Van Dorn Rd
- 2257 Ballston Place