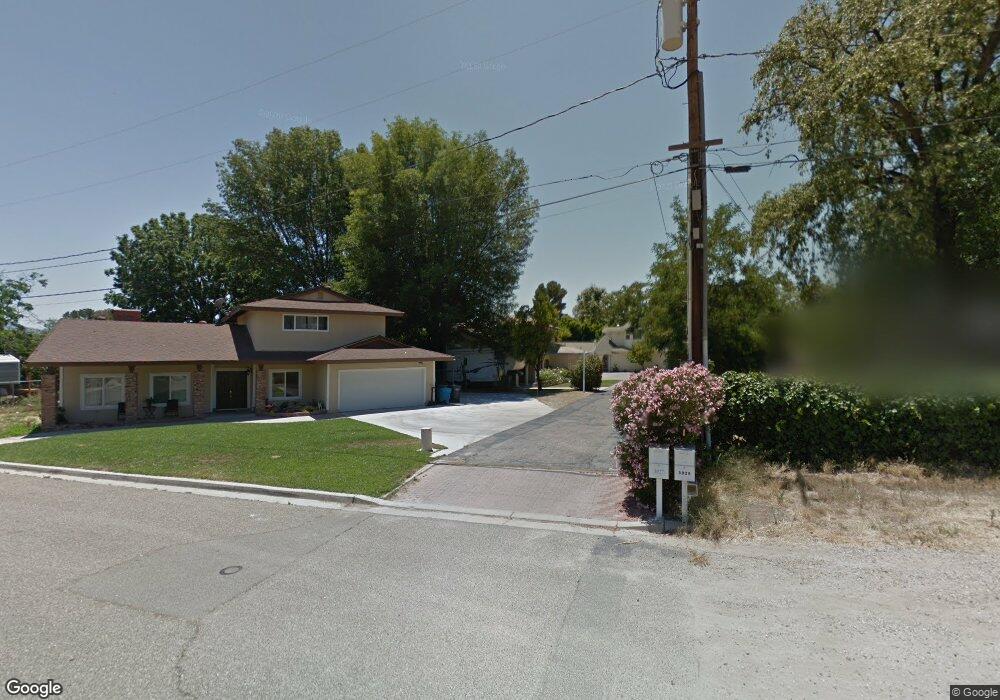
3027 Country Ln Simi Valley, CA 93063
Central Simi Valley NeighborhoodEstimated Value: $1,006,707 - $1,094,000
3
Beds
3
Baths
2,234
Sq Ft
$474/Sq Ft
Est. Value
About This Home
This home is located at 3027 Country Ln, Simi Valley, CA 93063 and is currently estimated at $1,059,177, approximately $474 per square foot. 3027 Country Ln is a home located in Ventura County with nearby schools including Sycamore Elementary School, Valley View Middle School, and Simi Valley High School.
Ownership History
Date
Name
Owned For
Owner Type
Purchase Details
Closed on
Apr 1, 2009
Sold by
Dickinson Wayne A and Dickinson Kathleen J
Bought by
Dickinson Wayne A and Dickinson Kathleen J
Current Estimated Value
Home Financials for this Owner
Home Financials are based on the most recent Mortgage that was taken out on this home.
Original Mortgage
$136,000
Outstanding Balance
$86,526
Interest Rate
5.06%
Mortgage Type
New Conventional
Estimated Equity
$972,651
Purchase Details
Closed on
Aug 15, 2003
Sold by
Dickinson Wayne A and Dickinson Kathleen J
Bought by
Dickinson Wayne A and Dickinson Kathleen J
Purchase Details
Closed on
Nov 4, 1993
Sold by
Hampton C W and Hampton Sandra E
Bought by
Dickinson Wayne A and Dickinson Kathy
Home Financials for this Owner
Home Financials are based on the most recent Mortgage that was taken out on this home.
Original Mortgage
$111,500
Interest Rate
6.7%
Create a Home Valuation Report for This Property
The Home Valuation Report is an in-depth analysis detailing your home's value as well as a comparison with similar homes in the area
Home Values in the Area
Average Home Value in this Area
Purchase History
| Date | Buyer | Sale Price | Title Company |
|---|---|---|---|
| Dickinson Wayne A | -- | Chicago Title | |
| Dickinson Wayne A | -- | Chicago Title | |
| Dickinson Wayne A | -- | -- | |
| Dickinson Wayne A | $231,500 | First American Title Ins Co |
Source: Public Records
Mortgage History
| Date | Status | Borrower | Loan Amount |
|---|---|---|---|
| Open | Dickinson Wayne A | $136,000 | |
| Previous Owner | Dickinson Wayne A | $111,500 |
Source: Public Records
Tax History Compared to Growth
Tax History
| Year | Tax Paid | Tax Assessment Tax Assessment Total Assessment is a certain percentage of the fair market value that is determined by local assessors to be the total taxable value of land and additions on the property. | Land | Improvement |
|---|---|---|---|---|
| 2025 | $4,953 | $393,434 | $203,942 | $189,492 |
| 2024 | $4,953 | $385,720 | $199,943 | $185,777 |
| 2023 | $4,656 | $378,157 | $196,022 | $182,135 |
| 2022 | $4,627 | $370,743 | $192,179 | $178,564 |
| 2021 | $4,583 | $363,474 | $188,411 | $175,063 |
| 2020 | $4,482 | $359,749 | $186,480 | $173,269 |
| 2019 | $4,276 | $352,696 | $182,824 | $169,872 |
| 2018 | $4,234 | $345,782 | $179,240 | $166,542 |
| 2017 | $4,135 | $339,003 | $175,726 | $163,277 |
| 2016 | $3,947 | $332,357 | $172,281 | $160,076 |
| 2015 | $3,858 | $327,367 | $169,695 | $157,672 |
| 2014 | $3,798 | $320,957 | $166,372 | $154,585 |
Source: Public Records
Map
Nearby Homes
- 3262 Avenida Simi
- 3060 Bianca Cir
- 2848 Jadestone Ave
- 2842 Topaz Ave
- 3160 Leslie Ct
- 2885 Circle View Dr
- 3049 Reservoir Dr
- 2877 Avenida Simi
- 3298 Wisdom Ct
- 3445 Presidio Ct
- 2753 Deerwood Ave
- 3067 Harrison Ln
- 3010 Tallahassee Ln
- 2660 Tumbleweed Ave
- 2679 Velma Ct
- 2649 Nicholas St
- 2514 Glenhurst Ct
- 2671 Coral Gum Ln
- 3434 Highwood Ct Unit 183
- 3474 Highwood Ct Unit 80
- 3039 Country Ln
- 3015 Country Ln
- 3315 Avenida Simi
- 3055 Country Ln
- 6517 Canyon Oaks Dr
- 6525 Canyon Oaks Dr
- 6524 Canyon Oaks Dr
- 6528 Canyon Oaks Dr
- 6516 Canyon Oaks Dr
- 6504 Canyon Oaks Dr
- 6505 Canyon Oaks Dr
- 6513 Canyon Oaks Dr
- 3279 Avenida Simi
- 3309 Avenida Simi
- 3225 Avenida Simi
- 3042 Evelyn Ave
- 3297 Avenida Simi
- 3058 Evelyn Ave
- 0 County Line Road Healy Unit SR18290010
- 3024 Country Ln