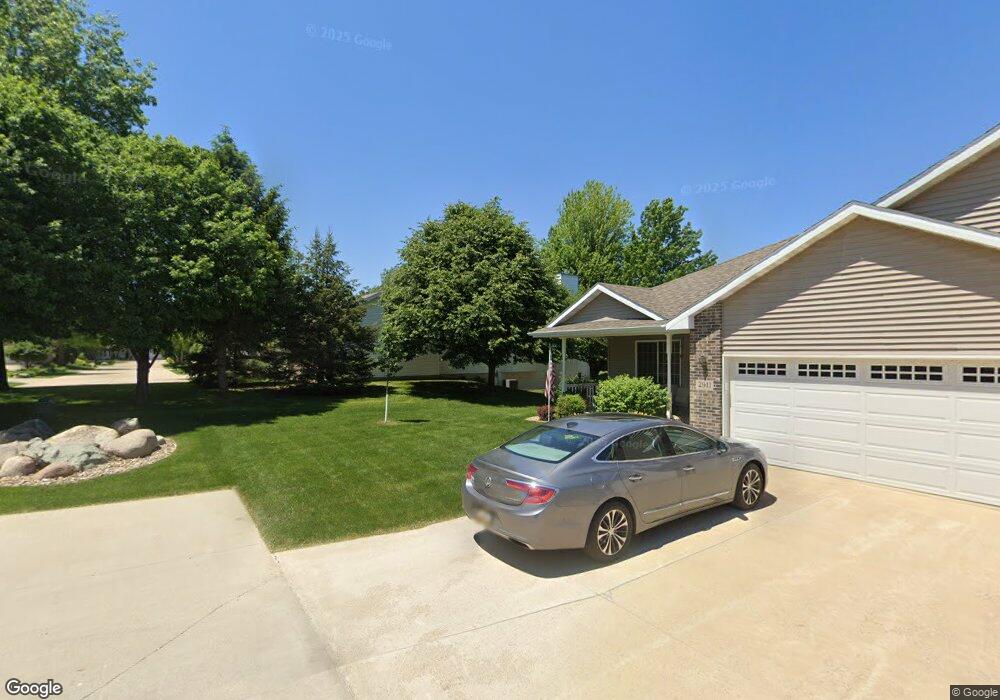
3027 Pheasant Dr Unit B Cedar Falls, IA 50613
Estimated Value: $343,000 - $389,000
3
Beds
3
Baths
2,490
Sq Ft
$147/Sq Ft
Est. Value
About This Home
This home is located at 3027 Pheasant Dr Unit B, Cedar Falls, IA 50613 and is currently estimated at $366,595, approximately $147 per square foot. 3027 Pheasant Dr Unit B is a home located in Black Hawk County with nearby schools including Helen A. Hansen Elementary School, Holmes Junior High School, and Cedar Falls High School.
Ownership History
Date
Name
Owned For
Owner Type
Purchase Details
Closed on
Oct 31, 2014
Sold by
Mullen Lawrence L and Mullen Tara P
Bought by
Grosboll Sue E
Current Estimated Value
Purchase Details
Closed on
Dec 27, 2012
Sold by
Secor W Scott and Secor Holly R
Bought by
Mullen Lawrence L and Mullen Tara P
Home Financials for this Owner
Home Financials are based on the most recent Mortgage that was taken out on this home.
Original Mortgage
$130,000
Interest Rate
3.25%
Mortgage Type
Adjustable Rate Mortgage/ARM
Purchase Details
Closed on
Nov 13, 2007
Sold by
Burg Construction Inc
Bought by
Wes Owen Construction Llc
Purchase Details
Closed on
Nov 27, 2006
Sold by
Larson Marian P and Larson Jerrel J
Bought by
Secor W Scott and Secor Holly R
Home Financials for this Owner
Home Financials are based on the most recent Mortgage that was taken out on this home.
Original Mortgage
$223,250
Interest Rate
6.47%
Mortgage Type
New Conventional
Create a Home Valuation Report for This Property
The Home Valuation Report is an in-depth analysis detailing your home's value as well as a comparison with similar homes in the area
Home Values in the Area
Average Home Value in this Area
Purchase History
| Date | Buyer | Sale Price | Title Company |
|---|---|---|---|
| Grosboll Sue E | $262,000 | None Available | |
| Mullen Lawrence L | $255,000 | None Available | |
| Wes Owen Construction Llc | $43,000 | None Available | |
| Secor W Scott | $235,000 | None Available |
Source: Public Records
Mortgage History
| Date | Status | Borrower | Loan Amount |
|---|---|---|---|
| Previous Owner | Mullen Lawrence L | $130,000 | |
| Previous Owner | Secor W Scott | $223,250 |
Source: Public Records
Tax History
| Year | Tax Paid | Tax Assessment Tax Assessment Total Assessment is a certain percentage of the fair market value that is determined by local assessors to be the total taxable value of land and additions on the property. | Land | Improvement |
|---|---|---|---|---|
| 2025 | $5,124 | $349,780 | $21,870 | $327,910 |
| 2024 | $5,124 | $342,340 | $21,870 | $320,470 |
| 2023 | $4,504 | $342,340 | $21,870 | $320,470 |
| 2022 | $4,558 | $252,890 | $19,440 | $233,450 |
| 2021 | $4,548 | $252,890 | $19,440 | $233,450 |
| 2020 | $4,456 | $252,890 | $19,440 | $233,450 |
| 2019 | $4,456 | $252,890 | $19,440 | $233,450 |
| 2018 | $4,288 | $240,780 | $19,440 | $221,340 |
| 2017 | $4,386 | $240,780 | $19,440 | $221,340 |
| 2016 | $4,254 | $240,780 | $19,440 | $221,340 |
| 2015 | $4,254 | $240,780 | $19,440 | $221,340 |
| 2014 | $4,304 | $240,780 | $19,440 | $221,340 |
Source: Public Records
Map
Nearby Homes
- 3702 Apollo St
- 2912 W 4th St Unit 2
- 3413 Pheasant Dr
- 2718 Ryan Dr
- 114 Parkgate Rd
- 0 W 1st St
- 929 Barnett Dr
- 2706 Country Meadow Ln
- 502 Oak Park Blvd
- 1115 Oak Park Blvd
- 4128 Shocker Rd
- 4124 Thresher Ct Unit 306
- 4125 Autumn Ridge Rd Unit 102
- Lots 1-2 Nordic Dr
- Lots 5-6 Nordic Dr
- Lots 3-4 Nordic Dr
- 0 W Glen Development Land
- 405 Golden Ln
- 3023 Wellington Dr
- 4305 Autumn Ridge Rd Unit 219
- 3027 Pheasant Dr Unit A
- 3029 Pheasant Dr Unit B
- 3029 Pheasant Dr Unit A
- 3035 Pheasant Dr Unit D
- 3035 Pheasant Dr Unit C
- 3035 Pheasant Dr Unit A
- 3025 Pheasant Dr Unit B
- 3025 Pheasant Dr Unit A
- 3023 Pheasant Dr Unit A
- 3023 Pheasant Dr Unit B
- 3008 Apollo St
- 3018 Apollo St
- 3002 Apollo St
- 3026 Apollo St
- 3011 W 4th St
- 2912 W 3rd St Unit B
- 3003 W 4th St
- 2922 Apollo St
- 3105 Pheasant Dr
- 2909 W 3rd St Unit A
Your Personal Tour Guide
Ask me questions while you tour the home.