Estimated Value: $905,795 - $993,000
5
Beds
3
Baths
2,088
Sq Ft
$455/Sq Ft
Est. Value
About This Home
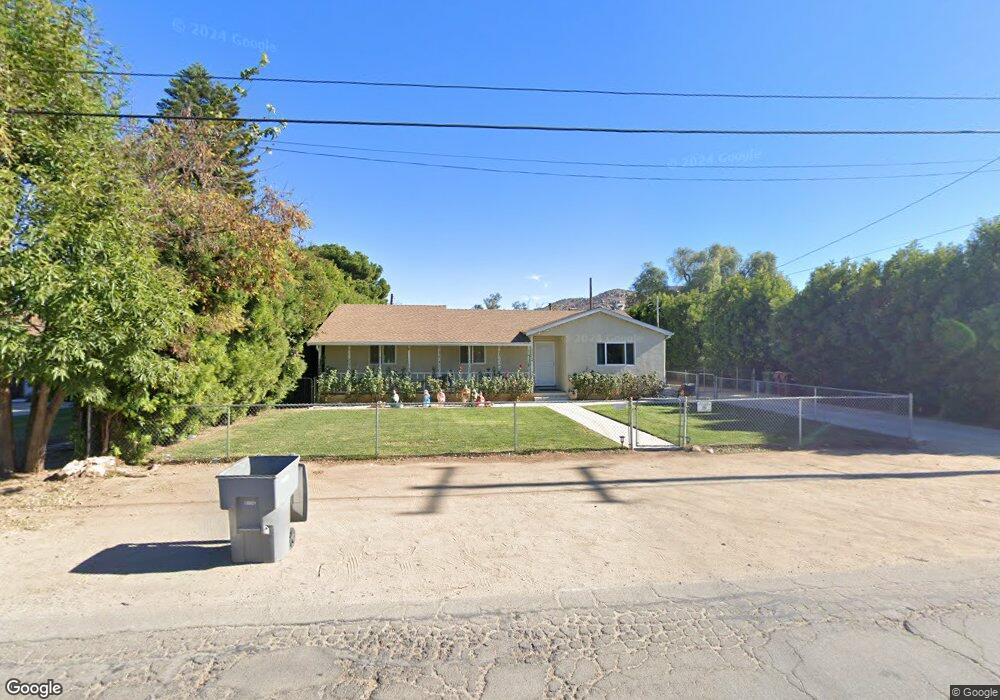
This home is located at 3029 Valley View Ave, Norco, CA 92860 and is currently estimated at $950,699, approximately $455 per square foot. 3029 Valley View Ave is a home located in Riverside County with nearby schools including Sierra Vista Elementary School, Norco Intermediate School, and Norco High School.
Ownership History
Date
Name
Owned For
Owner Type
Purchase Details
Closed on
Dec 20, 2002
Sold by
Langlois Adam G and Langlois Julianna
Bought by
Langlois Adam G and Langlois Julianna
Current Estimated Value
Home Financials for this Owner
Home Financials are based on the most recent Mortgage that was taken out on this home.
Original Mortgage
$181,350
Interest Rate
5.97%
Mortgage Type
Purchase Money Mortgage
Purchase Details
Closed on
Oct 24, 2000
Sold by
Rasmussen Mary K and Blandford Mary K
Bought by
Longlois Adam G and Rager Julie
Home Financials for this Owner
Home Financials are based on the most recent Mortgage that was taken out on this home.
Original Mortgage
$193,600
Interest Rate
7.66%
Mortgage Type
Purchase Money Mortgage
Purchase Details
Closed on
Oct 30, 1995
Sold by
Blandford Thomas G
Bought by
Blandford Mary K
Create a Home Valuation Report for This Property
The Home Valuation Report is an in-depth analysis detailing your home's value as well as a comparison with similar homes in the area
Home Values in the Area
Average Home Value in this Area
Purchase History
| Date | Buyer | Sale Price | Title Company |
|---|---|---|---|
| Langlois Adam G | -- | First American Title Co | |
| Longlois Adam G | $242,000 | First American Title Co | |
| Rasmussen Mary K | -- | First American Title Co | |
| Blandford Mary K | -- | Old Republic Title Company |
Source: Public Records
Mortgage History
| Date | Status | Borrower | Loan Amount |
|---|---|---|---|
| Closed | Langlois Adam G | $181,350 | |
| Closed | Longlois Adam G | $193,600 |
Source: Public Records
Tax History Compared to Growth
Tax History
| Year | Tax Paid | Tax Assessment Tax Assessment Total Assessment is a certain percentage of the fair market value that is determined by local assessors to be the total taxable value of land and additions on the property. | Land | Improvement |
|---|---|---|---|---|
| 2025 | $4,875 | $452,869 | $215,463 | $237,406 |
| 2023 | $4,875 | $435,286 | $207,098 | $228,188 |
| 2022 | $4,717 | $426,752 | $203,038 | $223,714 |
| 2021 | $4,622 | $418,385 | $199,057 | $219,328 |
| 2020 | $4,570 | $414,096 | $197,016 | $217,080 |
| 2019 | $4,462 | $405,977 | $193,153 | $212,824 |
| 2018 | $4,359 | $398,017 | $189,367 | $208,650 |
| 2017 | $4,249 | $390,213 | $185,654 | $204,559 |
| 2016 | $4,205 | $382,563 | $182,014 | $200,549 |
| 2015 | $3,022 | $278,320 | $179,280 | $99,040 |
| 2014 | $2,909 | $272,869 | $175,769 | $97,100 |
Source: Public Records
Map
Nearby Homes
- 3134 Half Circle Rd
- 1366 Arroyo Ln
- 3202 Half Circle Rd
- 2830 Valley View Ave
- 3255 Sierra Ave
- 2703 Reservoir Dr
- 1531 Elm Dr
- 1379 5th St
- 2633 Valley View Ave
- 2597 Corona Ave
- 2627 Valley View Ave
- 2582 Reservoir Dr
- 887 Kingman Dr
- 2655 Hamner Ave
- 3496 Hamner Ave
- 3480 Hamner Ave
- 0 6th & Corona Unit SW25164144
- 970 3rd St
- 1100 6th St
- 3475 Hillside Ave
- 3071 Valley View Ave
- 3038 Valley View Ave
- 3054 Valley View Ave
- 3010 Valley View Ave
- 3057 Valley View Ave
- 3015 Valley View Ave
- 0 Valley View Ave
- 1347 Arroyo Ln
- 3114 Half Circle Rd
- 2966 Valley View Ave
- 3068 Valley View Ave
- 1283 Gallop Ln
- 3100 Valley View Ave
- 1361 Arroyo Ln
- 1346 Arroyo Ln
- 1230 Gallop Ln
- 2938 Valley View Ave
- 2929 Valley View Ave
- 1281 4th St
- 3167 Valley View Ave