NOT LISTED FOR SALE

303 Division St Neenah, WI 54956

Estimated Value: $154,000 - $202,000

2 Beds
2 Baths
1,333 Sq Ft
$135/Sq Ft Est. Value

Last Sold September 27, 2013

Last sale price $89,000 $67 Per Sq Ft

Est. 102% increase in value since last sale

Current estimated payment $1,172/month

About This Home

As of September 2013

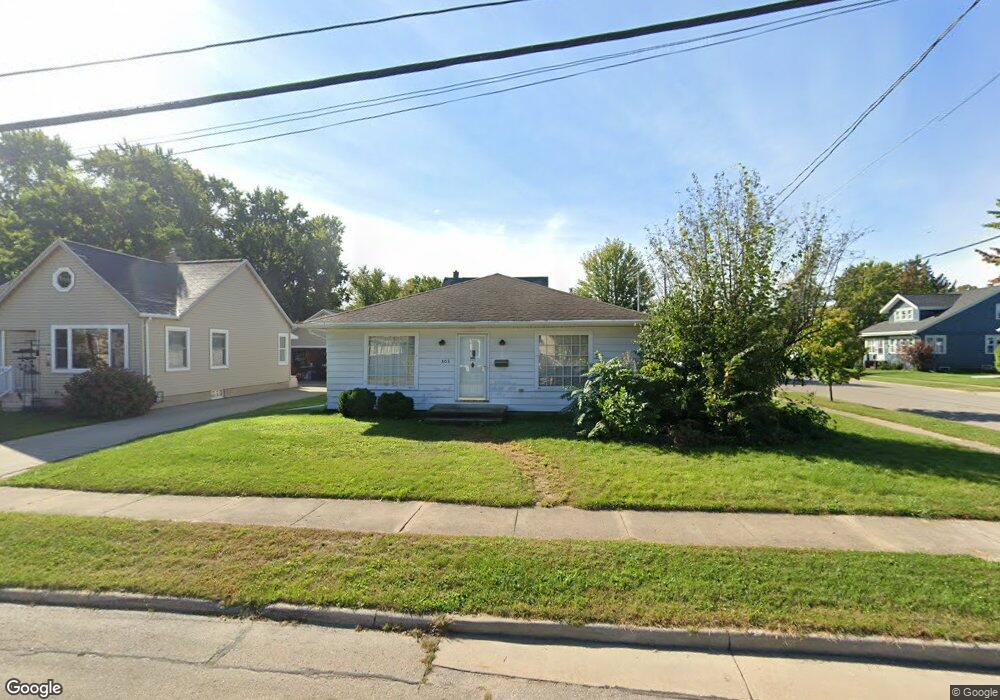
Adorable home set in the Heart of Neenah! Within walking distance to the schools, parks & shopping areas. Featuring a wood burning fireplace in Bedroom 2, and a 3 Seasons Room to relax in after a hard days work. Washer/dryer hookups on both the 1st floor or in the basement. Open concept in the living room and dining area, making it easy to adjust your living space. Dont miss out!

Range of Values:

Collateral Analytics

Collateral Analytics Collateral Analytics AVMs (Automated Valuation Model) employ a number of statistical approaches combined with neighborhood-specific comparable selection guarantees the most up-to-date and precise valuations.

Not Available

Collateral Analytics does not have data for the current month. Please view the chart for historical values.

ICE

ICE Mortgage Technology ICE Mortgage Technology’s AVM (Automated Valuation Model) is a state-of-the-art online residential property valuation tool that provides a quick and accurate estimate of the value of almost any home in the U.S.

Not Available

ICE Mortgage Technology does not have data for the current month. Please view the chart for historical values.

First American

First American First American Data & Analytics’ next-generation AVM combines unrivaled data assets with a blended ensemble of valuation models to produce highly accurate, reliable valuations you can trust.

Not Available

First American does not have data for the current month. Please view the chart for historical values.

Quantarium

Quantarium Quantarium’s valuation service, repeatedly proven the industry’s most accurate and comprehensive, is supercharged with a self-learning and auto-tuning AI engine that continually becomes smarter and more accurate as it processes daily inputs from the industry’s leading RE data lake.

Not Available

Quantarium does not have data for the current month. Please view the chart for historical values.

Average Value
Not Available
List Price
Sold Price
Create a Home Valuation Report for This Property
The Home Valuation Report is an in-depth analysis detailing your home's value as well as a comparison with similar homes in the area

Home Values in the Area

Source: Public Records

Average Home Value in this Area


Source: Public Records

Property History

Date Event Price List to Sale Price per Sq Ft Prior Sale
09/27/2013 09/27/13 Sold $89,000 0.0% $67 / Sq Ft View Prior Sale
09/23/2013 09/23/13 Pending -- -- --
05/22/2013 05/22/13 For Sale $89,000 -- $67 / Sq Ft

Tax History Compared to Growth

Source: Public Records

Tax History

Year Tax Paid Tax Assessment Tax Assessment Total Assessment is a certain percentage of the fair market value that is determined by local assessors to be the total taxable value of land and additions on the property. Land Improvement
2024 $2,618 $138,500 $20,000 $118,500
2023 $1,786 $60,400 $11,800 $48,600
2022 $1,768 $133,500 $22,500 $111,000
2021 $1,608 $131,000 $22,500 $108,500
2020 $3,146 $131,000 $22,500 $108,500
2019 $9,241 $131,000 $22,500 $108,500
2018 $9,178 $104,700 $19,900 $84,800
2017 $1,484 $104,700 $19,900 $84,800
2016 $1,930 $104,700 $19,900 $84,800
2015 $1,923 $69,600 $11,800 $57,800
2014 $2,129 $69,600 $11,800 $57,800
2013 $2,221 $69,600 $11,800 $57,800
Source: Public Records

Agents Affiliated with this Home

See All Agents

Map