303 E Division St Belding, MI 48809
Estimated Value: $184,801 - $195,000
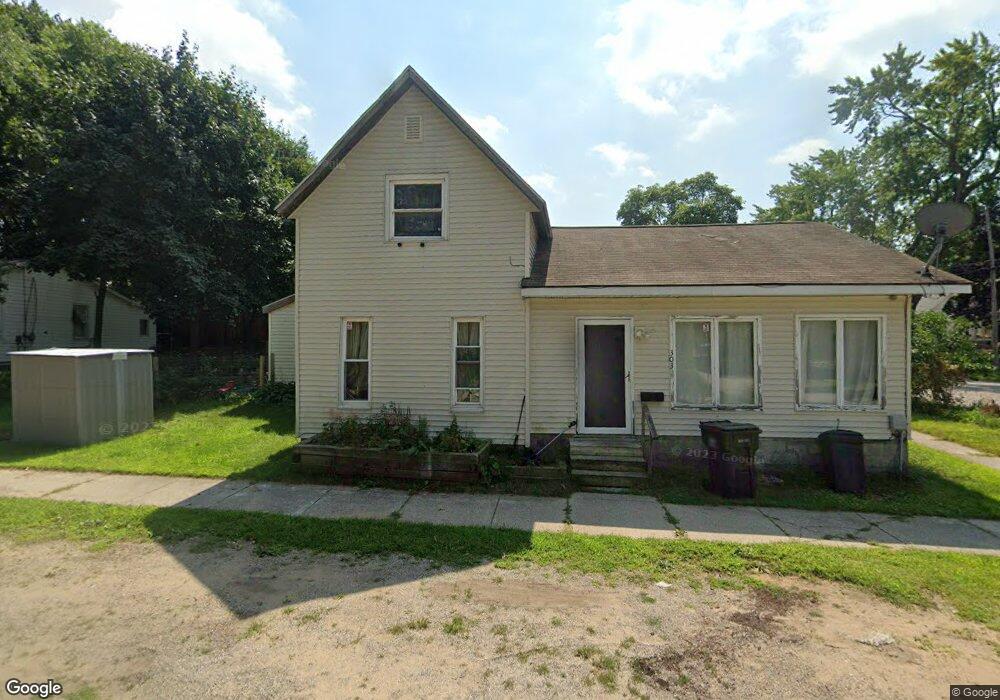
About This Home
This home is located at 303 E Division St, Belding, MI 48809 and is currently estimated at $189,950, approximately $162 per square foot. 303 E Division St is a home located in Ionia County with nearby schools including Ellis Elementary School, Woodview Elementary School, and Belding Middle School.
Ownership History
We collect this data history from publicly available records. To have your information removed, we recommend requesting removal directly through your county’s website.
Purchase Details
Purchase Details
Purchase Details
Home Values in the Area
Average Home Value in this Area
Purchase History
We collect this data history from publicly available records. To have your information removed, we recommend requesting removal directly through your county’s website.
| Date | Buyer | Sale Price | Title Company |
|---|---|---|---|
| -- | None Available | ||
| $1,831 | E Title Agency | ||
| $57,762 | None Available |
Tax History
We collect this data history from publicly available records. To have your information removed, we recommend requesting removal directly through your county’s website.
| Year | Tax Paid | Tax Assessment Tax Assessment Total Assessment is a certain percentage of the fair market value that is determined by local assessors to be the total taxable value of land and additions on the property. | Land | Improvement |
|---|---|---|---|---|
| 2025 | $1,618 | $73,000 | $8,700 | $64,300 |
| 2024 | $16 | $73,000 | $8,700 | $64,300 |
| 2023 | $1,510 | $53,500 | $8,000 | $45,500 |
| 2022 | $1,438 | $53,500 | $8,000 | $45,500 |
| 2021 | $1,462 | $45,100 | $5,200 | $39,900 |
| 2020 | $1,388 | $45,100 | $5,200 | $39,900 |
| 2019 | $1,297 | $41,400 | $5,000 | $36,400 |
| 2018 | $1,416 | $29,100 | $5,700 | $23,400 |
| 2017 | $1,308 | $29,100 | $5,700 | $23,400 |
| 2016 | $1,297 | $27,100 | $3,500 | $23,600 |
| 2015 | -- | $27,100 | $3,500 | $23,600 |
| 2014 | $1,355 | $24,500 | $3,400 | $21,100 |
Map
- 415 Ionia St
- 803 James St
- 107 W Center St
- 404 S Bridge St
- 311 S Bridge St
- 716 S Broas St
- 1028 Alderman St
- 413 S Front St
- 1044 S Bridge St
- 940 S Front St
- 632 Edgewood St
- 249 Thurman St
- 836 Morgan Dr
- 857 Merrick St
- 208 Leonard St
- 216 Leonard St
- 527 W Ellis St
- 6961 Riverwood Dr
- 1012 Masonic St
- 610 W Ellis Ave
Ask me questions while you tour the home.