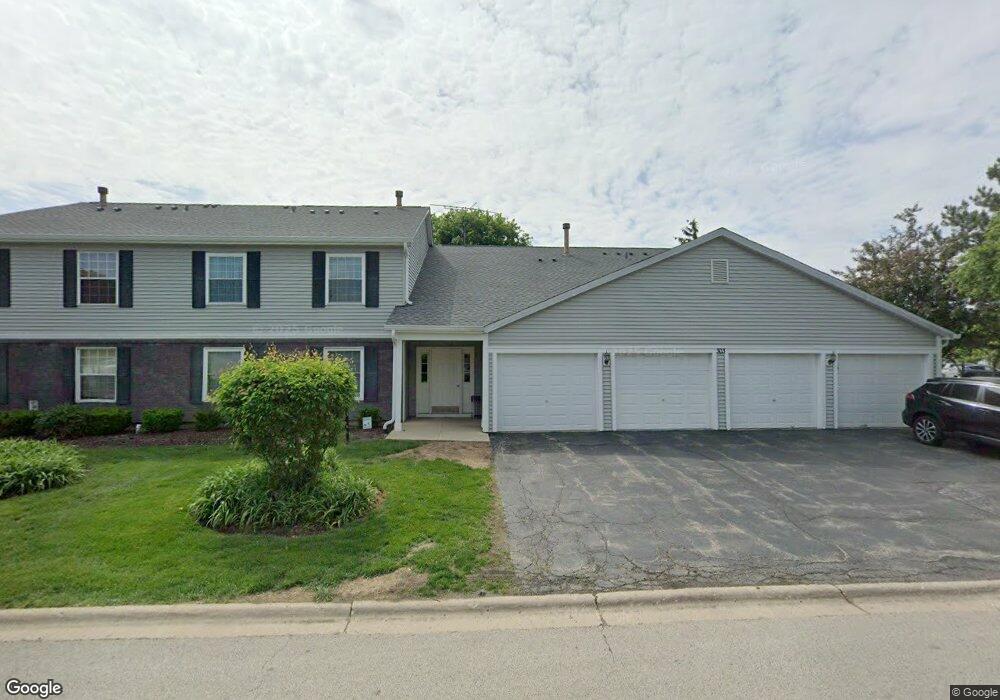
303 Newport Ln Unit C1 Bartlett, IL 60103
Estimated Value: $206,855 - $257,000
2
Beds
2
Baths
900
Sq Ft
$257/Sq Ft
Est. Value
About This Home
This home is located at 303 Newport Ln Unit C1, Bartlett, IL 60103 and is currently estimated at $231,714, approximately $257 per square foot. 303 Newport Ln Unit C1 is a home located in Cook County with nearby schools including Bartlett Elementary School, Eastview Middle School, and South Elgin High School.
Ownership History
Date
Name
Owned For
Owner Type
Purchase Details
Closed on
Jul 15, 2003
Sold by
Sacco Frank and Sacco Sandra L
Bought by
Ralston Kent
Current Estimated Value
Home Financials for this Owner
Home Financials are based on the most recent Mortgage that was taken out on this home.
Original Mortgage
$109,600
Outstanding Balance
$41,013
Interest Rate
4%
Mortgage Type
Unknown
Estimated Equity
$190,701
Purchase Details
Closed on
Oct 23, 2000
Sold by
Capone Oyerholser Dolores A
Bought by
Sacco Frank and Sacco Sandra L
Home Financials for this Owner
Home Financials are based on the most recent Mortgage that was taken out on this home.
Original Mortgage
$84,400
Interest Rate
7.87%
Purchase Details
Closed on
Feb 24, 1999
Sold by
Anderson David S
Bought by
Overholser Dolores A Capone
Create a Home Valuation Report for This Property
The Home Valuation Report is an in-depth analysis detailing your home's value as well as a comparison with similar homes in the area
Home Values in the Area
Average Home Value in this Area
Purchase History
| Date | Buyer | Sale Price | Title Company |
|---|---|---|---|
| Ralston Kent | $137,000 | Preferred Title Ins Agency | |
| Sacco Frank | -- | -- | |
| Overholser Dolores A Capone | $93,000 | -- |
Source: Public Records
Mortgage History
| Date | Status | Borrower | Loan Amount |
|---|---|---|---|
| Open | Ralston Kent | $109,600 | |
| Previous Owner | Sacco Frank | $84,400 |
Source: Public Records
Tax History
| Year | Tax Paid | Tax Assessment Tax Assessment Total Assessment is a certain percentage of the fair market value that is determined by local assessors to be the total taxable value of land and additions on the property. | Land | Improvement |
|---|---|---|---|---|
| 2025 | $4,049 | $18,805 | $727 | $18,078 |
| 2024 | $4,049 | $12,794 | $519 | $12,275 |
| 2023 | $3,913 | $12,794 | $519 | $12,275 |
| 2022 | $3,913 | $12,794 | $519 | $12,275 |
| 2021 | $3,377 | $9,087 | $441 | $8,646 |
| 2020 | $3,332 | $9,087 | $441 | $8,646 |
| 2019 | $3,348 | $10,211 | $441 | $9,770 |
| 2018 | $2,429 | $6,794 | $389 | $6,405 |
| 2017 | $2,388 | $6,794 | $389 | $6,405 |
| 2016 | $2,230 | $6,794 | $389 | $6,405 |
| 2015 | $1,931 | $5,445 | $337 | $5,108 |
| 2014 | $1,907 | $5,445 | $337 | $5,108 |
| 2013 | $1,833 | $5,445 | $337 | $5,108 |
Source: Public Records
Map
Nearby Homes
- 303 Newport Ln Unit D2
- 355 Wilmington Dr Unit C1
- 370 Wilmington Dr Unit D2
- 615 Mallard Ct Unit C2
- 748 Sterling Ct Unit A2
- 318 S Prospect Ave
- 745 Candleridge Ct Unit B2
- 195 Mary Ct Unit A
- 194 Robert Ct Unit A
- 119 E Railroad Ave
- 334 Marcia Ct Unit C
- 110 N Chase Ave
- 275 E Railroad Ave Unit 101
- 27W607 Devon Ave
- 195 E Oak Glen Dr
- 1105 Sandpiper Ct
- 6881 Hickory St
- 1110 Sausalito Ct
- 140 N Elroy Ave
- 361 Sundance Dr
- 303 Newport Ln Unit C2
- 303 Newport Ln Unit D2
- 303 Newport Ln Unit D1
- 311 Newport Ln Unit B1
- 311 Newport Ln Unit A1
- 311 Newport Ln Unit A2
- 311 Newport Ln Unit B2
- 657 Thorntree Ct Unit C2
- 657 Thorntree Ct Unit C1
- 657 Thorntree Ct Unit D1
- 657 Thorntree Ct Unit D2
- 657 Thorntree Ct Unit 27B22
- 310 Newport Ln Unit C2
- 310 Newport Ln Unit D2
- 310 Newport Ln Unit C1
- 310 Newport Ln Unit 35A12
- 302 Newport Ln Unit A2
- 302 Newport Ln Unit B1
- 302 Newport Ln Unit B2
- 302 Newport Ln Unit A1
Your Personal Tour Guide
Ask me questions while you tour the home.