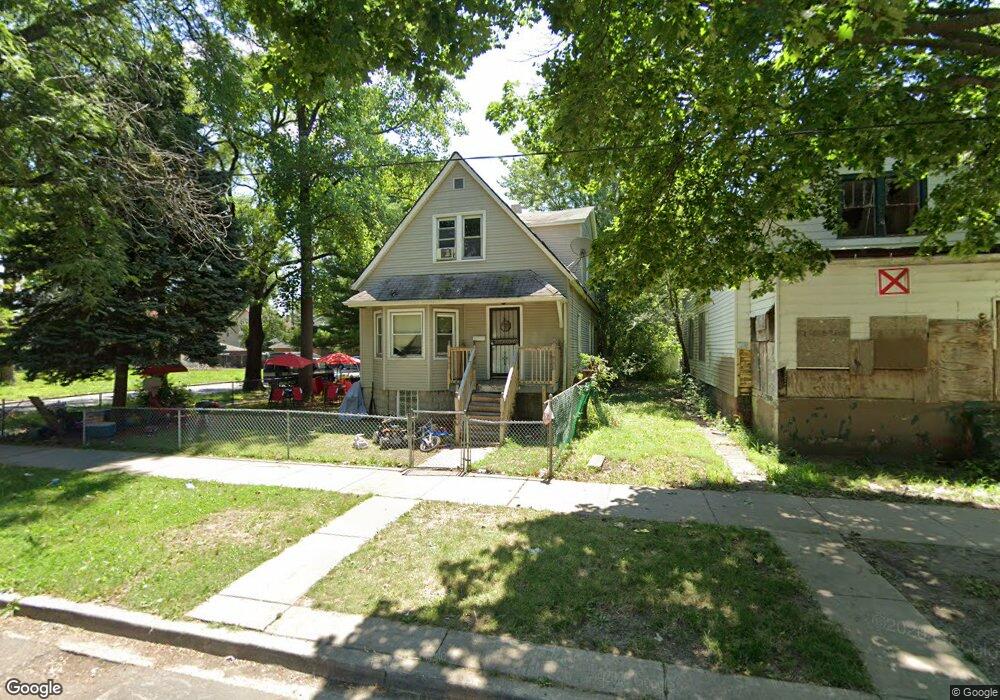
303 W 110th St Chicago, IL 60628
Roseland NeighborhoodEstimated Value: $65,000 - $127,000
5
Beds
2
Baths
1,744
Sq Ft
$50/Sq Ft
Est. Value
About This Home
This home is located at 303 W 110th St, Chicago, IL 60628 and is currently estimated at $87,619, approximately $50 per square foot. 303 W 110th St is a home located in Cook County with nearby schools including Lavizzo Elementary School and Corliss High School.
Ownership History
Date
Name
Owned For
Owner Type
Purchase Details
Closed on
Apr 6, 2009
Sold by
Us Bank National Association
Bought by
Smith Larry
Current Estimated Value
Purchase Details
Closed on
May 8, 2008
Sold by
Samba Malick
Bought by
Us Bank Na and Wachovia Bank Na
Purchase Details
Closed on
Oct 29, 2002
Sold by
Price Andre V
Bought by
Samba Malick and Samba Mariama
Home Financials for this Owner
Home Financials are based on the most recent Mortgage that was taken out on this home.
Original Mortgage
$69,000
Interest Rate
6.38%
Purchase Details
Closed on
Jan 9, 2002
Sold by
Household Finance Corp Iii
Bought by
Price Andre V
Home Financials for this Owner
Home Financials are based on the most recent Mortgage that was taken out on this home.
Original Mortgage
$54,080
Interest Rate
7.16%
Mortgage Type
Construction
Purchase Details
Closed on
Mar 12, 2001
Sold by
Templeton Ralph S
Bought by
Household Finance Corp Iii
Create a Home Valuation Report for This Property
The Home Valuation Report is an in-depth analysis detailing your home's value as well as a comparison with similar homes in the area
Home Values in the Area
Average Home Value in this Area
Purchase History
| Date | Buyer | Sale Price | Title Company |
|---|---|---|---|
| Smith Larry | $7,500 | Premier Title Company | |
| Us Bank Na | -- | None Available | |
| Samba Malick | $55,500 | Multiple | |
| Price Andre V | $37,000 | -- | |
| Household Finance Corp Iii | -- | -- |
Source: Public Records
Mortgage History
| Date | Status | Borrower | Loan Amount |
|---|---|---|---|
| Previous Owner | Samba Malick | $69,000 | |
| Previous Owner | Price Andre V | $54,080 |
Source: Public Records
Tax History Compared to Growth
Tax History
| Year | Tax Paid | Tax Assessment Tax Assessment Total Assessment is a certain percentage of the fair market value that is determined by local assessors to be the total taxable value of land and additions on the property. | Land | Improvement |
|---|---|---|---|---|
| 2024 | -- | $5,200 | $2,310 | $2,890 |
| 2023 | -- | $2,304 | $1,540 | $764 |
| 2022 | $0 | $2,304 | $1,540 | $764 |
| 2021 | $397 | $2,303 | $1,540 | $763 |
| 2020 | $397 | $4,880 | $2,117 | $2,763 |
| 2019 | $390 | $5,363 | $2,117 | $3,246 |
| 2018 | $382 | $5,363 | $2,117 | $3,246 |
| 2017 | $869 | $7,401 | $1,925 | $5,476 |
| 2016 | $984 | $7,401 | $1,925 | $5,476 |
| 2015 | $878 | $7,401 | $1,925 | $5,476 |
| 2014 | $770 | $6,707 | $1,732 | $4,975 |
| 2013 | $743 | $6,707 | $1,732 | $4,975 |
Source: Public Records
Map
Nearby Homes
- 220 W 109th Place
- 341 W 109th St
- 343 W 108th Place
- 221 W 108th Place
- 225 W 108th Place
- 121 W 110th St
- 119 W 110th St
- 10939 S Normal Ave
- 104 W 110th Place
- 323 W 108th St
- 10956 S Normal Ave
- 10954 S Normal Ave
- 11136 S Eggleston Ave
- 10813 S Eggleston Ave
- 256 W 108th St
- 10807 S Wentworth Ave
- 10837 S Normal Ave
- 226 W 112th Place
- 10113 S La Salle St
- 222 W 110th St
- 307 W 110th St
- 301 W 110th St
- 315 W 110th St
- 302 W 110th Place
- 302 W 110th St
- 306 W 110th Place
- 251 W 110th St
- 308 W 110th Place
- 312 W 110th St
- 321 W 110th St
- 310 W 110th Place
- 258 W 110th Place
- 316 W 110th Place
- 254 W 110th St
- 318 W 110th St
- 250 W 110th St
- 250 W 110th Place
- 318 W 110th Place
- 327 W 110th St
- 245 W 110th St