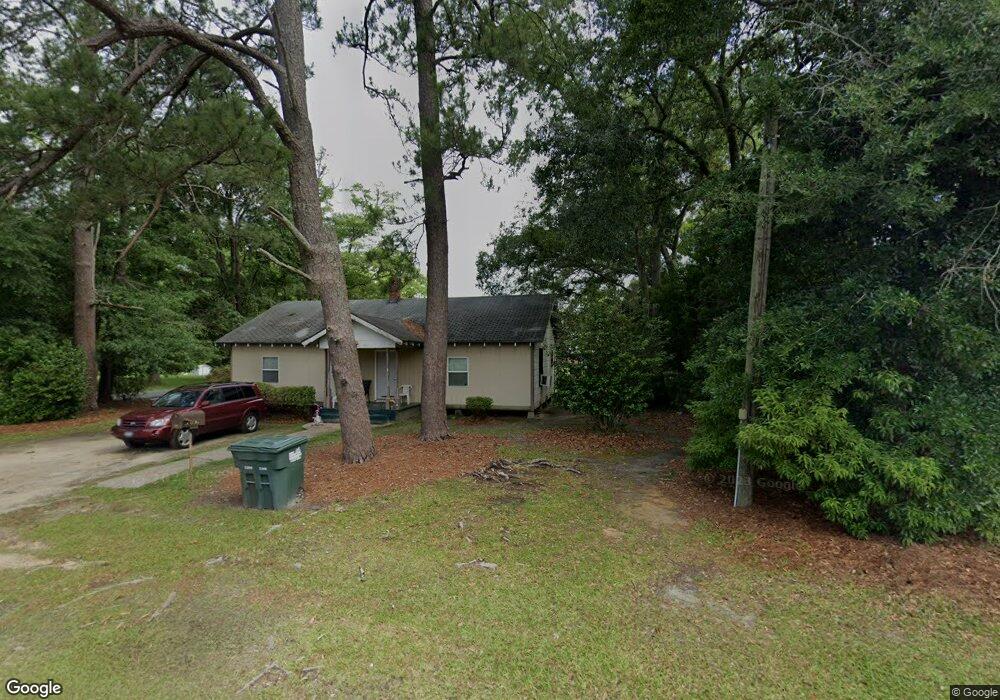
303 W Bartow St Quitman, GA 31643
Estimated Value: $85,000 - $151,000
2
Beds
2
Baths
2,123
Sq Ft
$56/Sq Ft
Est. Value
About This Home
This home is located at 303 W Bartow St, Quitman, GA 31643 and is currently estimated at $119,905, approximately $56 per square foot. 303 W Bartow St is a home located in Brooks County with nearby schools including Quitman Elementary School and First Baptist Church Preschool & Kindergarten.
Ownership History
Date
Name
Owned For
Owner Type
Purchase Details
Closed on
Oct 24, 2017
Sold by
Slone William
Bought by
Makdonado Guillermo Gregorio
Current Estimated Value
Purchase Details
Closed on
Jul 3, 2012
Sold by
Willis William T
Bought by
Slone William
Purchase Details
Closed on
Apr 24, 2006
Sold by
Jpmorgan Chase Bank
Bought by
Willis William T
Purchase Details
Closed on
Feb 14, 2006
Sold by
Newson Martha
Bought by
Jp Morgan Chase Bank
Purchase Details
Closed on
Dec 6, 2005
Sold by
Newsome Martha
Bought by
Jpmorgan Chase Bank
Purchase Details
Closed on
Mar 23, 1998
Sold by
Borsody Gerald R and Bella Ann
Bought by
Newson Martha
Purchase Details
Closed on
Jun 15, 1984
Sold by
Burnette Burnette G and Burnette James A
Bought by
Borsody Gerald R and Bella Ann
Purchase Details
Closed on
Jun 15, 1981
Sold by
Burnette Annie E
Bought by
Burnette Burnette G and Burnette James A
Create a Home Valuation Report for This Property
The Home Valuation Report is an in-depth analysis detailing your home's value as well as a comparison with similar homes in the area
Home Values in the Area
Average Home Value in this Area
Purchase History
| Date | Buyer | Sale Price | Title Company |
|---|---|---|---|
| Makdonado Guillermo Gregorio | -- | -- | |
| Slone William | -- | -- | |
| Willis William T | $39,000 | -- | |
| Jp Morgan Chase Bank | -- | -- | |
| Jpmorgan Chase Bank | $53,427 | -- | |
| Newson Martha | $33,000 | -- | |
| Borsody Gerald R | $6,500 | -- | |
| Burnette Burnette G | $12,000 | -- |
Source: Public Records
Tax History
| Year | Tax Paid | Tax Assessment Tax Assessment Total Assessment is a certain percentage of the fair market value that is determined by local assessors to be the total taxable value of land and additions on the property. | Land | Improvement |
|---|---|---|---|---|
| 2025 | $1,169 | $35,716 | $2,960 | $32,756 |
| 2024 | $1,169 | $35,716 | $2,960 | $32,756 |
| 2023 | $1,013 | $30,956 | $2,960 | $27,996 |
| 2022 | $825 | $23,316 | $2,920 | $20,396 |
| 2021 | $744 | $20,636 | $2,920 | $17,716 |
| 2020 | $728 | $20,636 | $2,920 | $17,716 |
| 2019 | $643 | $21,116 | $3,960 | $17,156 |
| 2018 | $768 | $21,116 | $3,960 | $17,156 |
| 2017 | $646 | $20,916 | $4,160 | $16,756 |
| 2016 | $639 | $20,916 | $4,160 | $16,756 |
| 2015 | -- | $20,756 | $4,160 | $16,596 |
| 2014 | -- | $34,352 | $4,160 | $30,192 |
| 2013 | -- | $34,352 | $4,160 | $30,192 |
Source: Public Records
Map
Nearby Homes
- 203 W Gordon St
- 606 N Court St
- 700 N Washington St
- Lot 14 Dawn Ln
- 807 N Court St
- 1001 W Bartow St
- 0 E Gordon St
- 506 Oglesby St
- 0 W Swamp St
- 309 Eastlake Dr
- 1501 W Screven St
- 714 Morris Ave
- 103 Victorian Way
- 103 Magnolia Dr
- 1306 E Screven St
- 804 Westlake Dr
- 0 Madison Hwy Unit 26460639
- 0 Madison Hwy Unit 147194
- 237 Turkey Ridge Ln
- 5036 Hamlin Rd
- 508 N Walker St
- 305 W Bartow St
- 207 W Bartow St
- 503 N Walker St
- 204 W Bartow St
- 415 N Walker St
- 510 N Madison St
- 200 W Bartow St
- 418 N Madison St
- 510 N Walker St
- 514 N Madison St
- 418 N Warren St
- 413 N Walker St
- 516 N Madison St
- 416 N Madison St
- 520 N Warren St
- 417 N Warren St
- 408 W Bartow St
- 518 N Madison St
- 209 W Gordon St
Your Personal Tour Guide
Ask me questions while you tour the home.