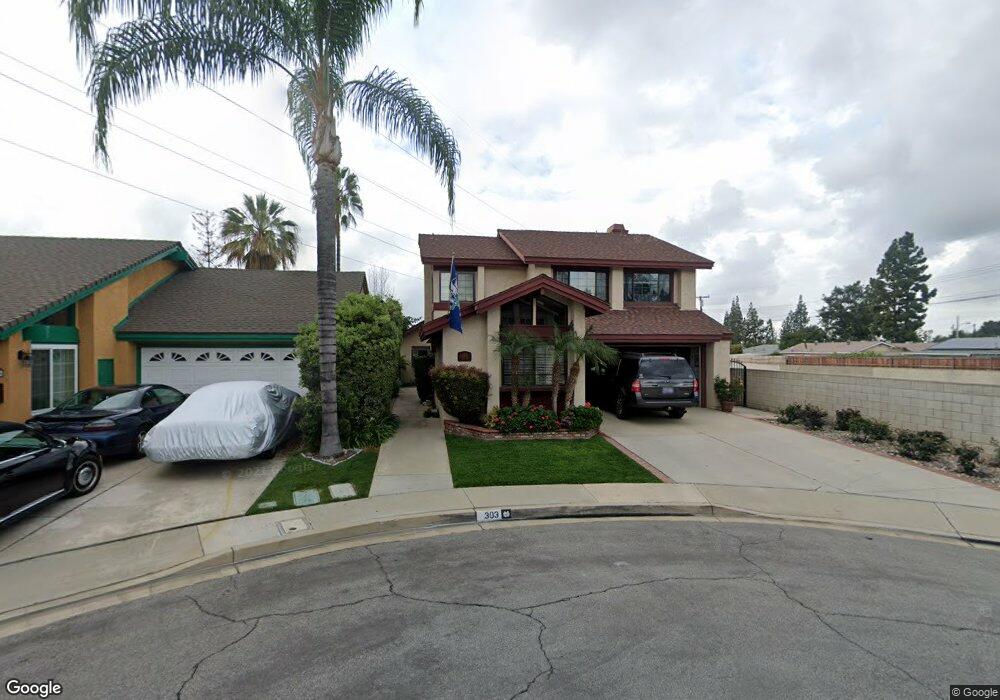
303 W Dawson Ct Glendora, CA 91740
Charter oak NeighborhoodEstimated Value: $818,000 - $910,000
4
Beds
2
Baths
1,784
Sq Ft
$485/Sq Ft
Est. Value
About This Home
This home is located at 303 W Dawson Ct, Glendora, CA 91740 and is currently estimated at $864,594, approximately $484 per square foot. 303 W Dawson Ct is a home located in Los Angeles County with nearby schools including Washington Elementary School, Royal Oak Middle School, and Charter Oak High School.
Ownership History
Date
Name
Owned For
Owner Type
Purchase Details
Closed on
Jan 30, 2001
Sold by
Decastro Jose E and Decastro Lina P
Bought by
Lockie Melbourne Randall and Lockie Kathleen Elizabeth
Current Estimated Value
Home Financials for this Owner
Home Financials are based on the most recent Mortgage that was taken out on this home.
Original Mortgage
$156,500
Outstanding Balance
$56,699
Interest Rate
7.12%
Estimated Equity
$807,895
Purchase Details
Closed on
May 10, 2000
Sold by
Bonk William F
Bought by
Bonk Jocelyn P Decastro and Decastro Lina P
Purchase Details
Closed on
Jun 5, 1998
Sold by
Federal Home Loan Mortgage Corporation
Bought by
Decastro Jose E and Decastro Lina P
Home Financials for this Owner
Home Financials are based on the most recent Mortgage that was taken out on this home.
Original Mortgage
$152,900
Interest Rate
7.11%
Purchase Details
Closed on
Feb 16, 1998
Sold by
Destura Amparado and Federal Home Loan Mortgage Cor
Bought by
Federal Home Loan Mortgage Corporation
Create a Home Valuation Report for This Property
The Home Valuation Report is an in-depth analysis detailing your home's value as well as a comparison with similar homes in the area
Home Values in the Area
Average Home Value in this Area
Purchase History
| Date | Buyer | Sale Price | Title Company |
|---|---|---|---|
| Lockie Melbourne Randall | $226,500 | Equity Title | |
| Bonk Jocelyn P Decastro | -- | -- | |
| Decastro Jose E | $170,000 | First American Title Co | |
| Federal Home Loan Mortgage Corporation | $142,600 | Stewart Title |
Source: Public Records
Mortgage History
| Date | Status | Borrower | Loan Amount |
|---|---|---|---|
| Open | Lockie Melbourne Randall | $156,500 | |
| Previous Owner | Decastro Jose E | $152,900 |
Source: Public Records
Tax History Compared to Growth
Tax History
| Year | Tax Paid | Tax Assessment Tax Assessment Total Assessment is a certain percentage of the fair market value that is determined by local assessors to be the total taxable value of land and additions on the property. | Land | Improvement |
|---|---|---|---|---|
| 2025 | $4,980 | $406,015 | $172,070 | $233,945 |
| 2024 | $4,980 | $398,055 | $168,697 | $229,358 |
| 2023 | $4,861 | $390,251 | $165,390 | $224,861 |
| 2022 | $4,798 | $382,600 | $162,148 | $220,452 |
| 2021 | $4,722 | $375,099 | $158,969 | $216,130 |
| 2019 | $4,612 | $363,974 | $154,254 | $209,720 |
| 2018 | $4,364 | $356,838 | $151,230 | $205,608 |
| 2017 | $4,300 | $349,842 | $148,265 | $201,577 |
| 2016 | $4,161 | $342,983 | $145,358 | $197,625 |
| 2015 | $4,142 | $337,832 | $143,175 | $194,657 |
| 2014 | $4,134 | $331,215 | $140,371 | $190,844 |
Source: Public Records
Map
Nearby Homes
- 1030 S Danehurst Ave
- 125 W Ronwood St
- 644 W Gaillard St
- 205 W Linfield St
- 149 Rosalynn Dr
- 946 S Glendora Ave
- 950 Forestdale Ave
- 330 W Payson St
- 1401 S Grand Ave
- 755 W Citrus Edge St
- 1065 S Prospero Dr
- 422 W Route 66 Unit 100
- 352 Temmera Ln
- 715 Forestdale Ave
- 337 W Route 66
- 337 W Route 66 Unit 58
- 449 E Haltern Ave
- 1700 S Glendora Ave Unit 40
- 1700 S Glendora Ave Unit 43
- 6138 N Traymore Ave
- 305 W Dawson Ct
- 307 W Dawson Ct Unit 1
- 307 W Dawson Ct
- 302 W Dawson Ct
- 330 W Citrus Edge St
- 336 W Citrus Edge St
- 304 W Dawson Ct
- 324 W Citrus Edge St
- 340 W Citrus Edge St
- 306 W Dawson Ct
- 319 W Dawson Ct
- 308 W Dawson Ct
- 350 W Citrus Edge St
- 310 W Dawson Ct
- 323 W Dawson Ct
- 327 W Dawson Ct
- 331 W Dawson Ct
- 335 W Dawson Ct
- 333 W Citrus Edge St
- 400 W Citrus Edge St