3030 Laurence Ct Concord, CA 94520
Glenbrook Heights NeighborhoodEstimated Value: $644,334 - $701,000
About This Home
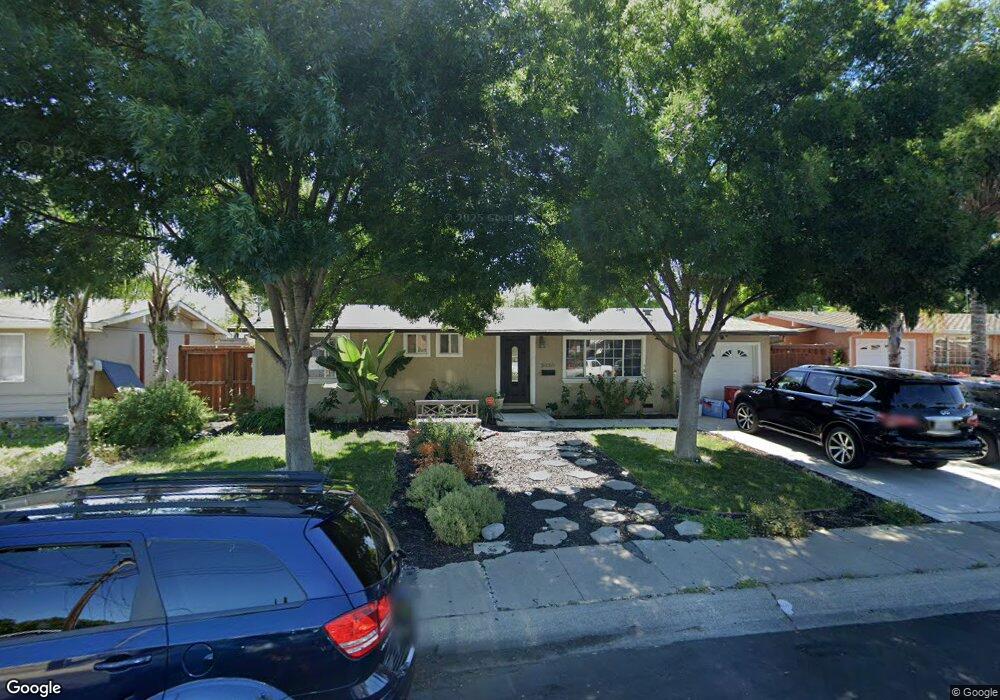
This home is located at 3030 Laurence Ct, Concord, CA 94520 and is currently estimated at $680,584, approximately $586 per square foot. 3030 Laurence Ct is a home located in Contra Costa County with nearby schools including Sun Terrace Elementary School, El Dorado Middle School, and Mt. Diablo High School.
Ownership History
We collect this data history from publicly available records. To have your information removed, we recommend requesting removal directly through your county’s website.
Purchase Details
Home Financials for this Owner
Home Financials are based on the most recent Mortgage that was taken out on this home.Purchase Details
Home Financials for this Owner
Home Financials are based on the most recent Mortgage that was taken out on this home.Purchase Details
Home Financials for this Owner
Home Financials are based on the most recent Mortgage that was taken out on this home.Purchase Details
Home Financials for this Owner
Home Financials are based on the most recent Mortgage that was taken out on this home.Purchase Details
Home Values in the Area
Average Home Value in this Area
Purchase History
We collect this data history from publicly available records. To have your information removed, we recommend requesting removal directly through your county’s website.
| Date | Buyer | Sale Price | Title Company |
|---|---|---|---|
| -- | Old Republic Title Company | ||
| $432,000 | Old Republic Title Company | ||
| -- | Ticor Title Company | ||
| -- | Ticor Title Company | ||
| -- | -- | ||
| $360,000 | Commonwealth Title | ||
| -- | Financial Title Company | ||
| $174,500 | Financial Title Company | ||
| $2,000 | Stewart Title Company | ||
| -- | -- |
Mortgage History
We collect this data history from publicly available records. To have your information removed, we recommend requesting removal directly through your county’s website.
| Date | Status | Borrower | Loan Amount |
|---|---|---|---|
| Open | $409,226 | ||
| Closed | $423,361 | ||
| Previous Owner | $359,000 | ||
| Previous Owner | $270,000 | ||
| Previous Owner | $169,504 | ||
| Previous Owner | $153,450 | ||
| Closed | $53,950 |
Tax History
We collect this data history from publicly available records. To have your information removed, we recommend requesting removal directly through your county’s website.
| Year | Tax Paid | Tax Assessment Tax Assessment Total Assessment is a certain percentage of the fair market value that is determined by local assessors to be the total taxable value of land and additions on the property. | Land | Improvement |
|---|---|---|---|---|
| 2025 | $6,743 | $519,189 | $403,217 | $115,972 |
| 2024 | $6,440 | $509,010 | $395,311 | $113,699 |
| 2023 | $6,440 | $499,030 | $387,560 | $111,470 |
| 2022 | $6,349 | $489,246 | $379,961 | $109,285 |
| 2021 | $6,190 | $479,654 | $372,511 | $107,143 |
| 2019 | $6,070 | $465,429 | $361,463 | $103,966 |
| 2018 | $5,838 | $456,304 | $354,376 | $101,928 |
| 2017 | $5,642 | $447,358 | $347,428 | $99,930 |
| 2016 | $5,483 | $438,587 | $340,616 | $97,971 |
| 2015 | $3,809 | $295,000 | $179,413 | $115,587 |
| 2014 | $3,476 | $267,000 | $162,384 | $104,616 |
Map
- 2342 Gehringer Dr
- 3367 Benton St
- 2261 Gehringer Dr
- 2467 Tanager Cir
- 2219 Acacia Dr
- 2363 Hemlock Ave
- 2465 Mountain View Dr
- 3436 Thunderbird Dr
- 3194 Esperanza Dr Unit 4
- 3453 Thunderbird Dr
- 3430 Sanford St
- 2530 Maple Ave
- 3355 Bennett Way
- 3555 Thunderbird Dr
- 3585 Esperanza Dr
- 3573 Falcon Dr
- 2102 Overhill Rd
- 2082 Overhill Rd
- 2161 Northwood Cir Unit D
- 3335 Northwood Dr Unit C
- 3273 Claudia Dr
- 3267 Claudia Dr
- 3279 Claudia Dr
- 3261 Claudia Dr
- 3285 Claudia Dr
- 3272 Claudia Dr
- 3266 Claudia Dr
- 3278 Claudia Dr
- 3260 Claudia Dr
- 3024 Laurence Ct
- 3284 Claudia Dr
- 3255 Claudia Dr
- 3289 Claudia Dr
- 3267 Ida Dr
- 3018 Laurence Ct
- 2497 Krueger Dr
- 3254 Claudia Dr
- 3261 Ida Dr
- 3273 Ida Dr
- 3290 Claudia Dr
Ask me questions while you tour the home.