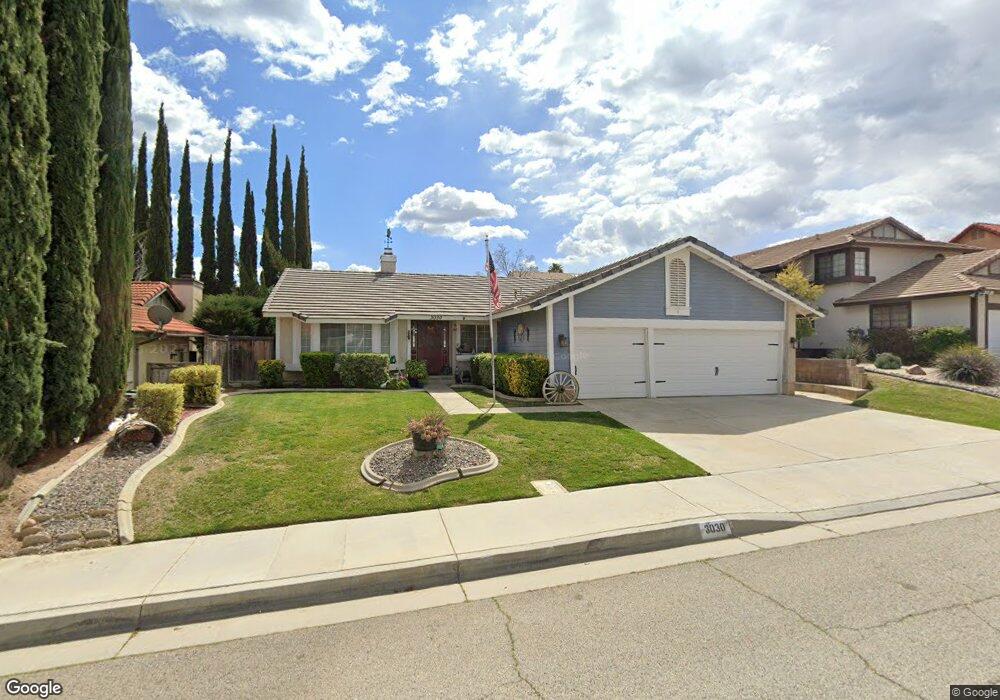
3030 Regency Way Palmdale, CA 93551
West Palmdale NeighborhoodEstimated Value: $493,471 - $546,000
4
Beds
2
Baths
1,666
Sq Ft
$307/Sq Ft
Est. Value
About This Home
This home is located at 3030 Regency Way, Palmdale, CA 93551 and is currently estimated at $512,118, approximately $307 per square foot. 3030 Regency Way is a home located in Los Angeles County with nearby schools including Cottonwood Elementary School, Hillview Middle, and Highland High School.
Ownership History
Date
Name
Owned For
Owner Type
Purchase Details
Closed on
Feb 14, 2026
Sold by
Forman Arthur T and Forman Linda S
Bought by
Arthur Forman And Linda Forman Living Trust and Forman
Current Estimated Value
Purchase Details
Closed on
Nov 7, 2000
Sold by
Heiling Randall
Bought by
Forman Arthur T and Forman Linda S
Home Financials for this Owner
Home Financials are based on the most recent Mortgage that was taken out on this home.
Original Mortgage
$118,000
Interest Rate
7.71%
Purchase Details
Closed on
Aug 29, 1995
Sold by
Va
Bought by
Heiling Randall
Home Financials for this Owner
Home Financials are based on the most recent Mortgage that was taken out on this home.
Original Mortgage
$79,818
Interest Rate
7.63%
Mortgage Type
Seller Take Back
Purchase Details
Closed on
Nov 25, 1994
Sold by
Bancboston Mtg Corp
Bought by
Va
Purchase Details
Closed on
Nov 18, 1994
Sold by
Dural Joseph C
Bought by
Bancboston Mtg Corp
Purchase Details
Closed on
Jul 27, 1994
Sold by
Dural Joseph C
Bought by
Williams Carolyn and Anderson Lawrence A
Create a Home Valuation Report for This Property
The Home Valuation Report is an in-depth analysis detailing your home's value as well as a comparison with similar homes in the area
Home Values in the Area
Average Home Value in this Area
Purchase History
| Date | Buyer | Sale Price | Title Company |
|---|---|---|---|
| Arthur Forman And Linda Forman Living Trust | -- | None Listed On Document | |
| Forman Arthur T | $148,000 | Investors Title Company | |
| Heiling Randall | $88,500 | First American Title Co | |
| Va | -- | First Southwestern Title | |
| Bancboston Mtg Corp | $99,478 | First Southwestern Title | |
| Williams Carolyn | -- | -- |
Source: Public Records
Mortgage History
| Date | Status | Borrower | Loan Amount |
|---|---|---|---|
| Previous Owner | Forman Arthur T | $118,000 | |
| Previous Owner | Heiling Randall | $79,818 |
Source: Public Records
Tax History
| Year | Tax Paid | Tax Assessment Tax Assessment Total Assessment is a certain percentage of the fair market value that is determined by local assessors to be the total taxable value of land and additions on the property. | Land | Improvement |
|---|---|---|---|---|
| 2025 | $3,694 | $222,986 | $44,588 | $178,398 |
| 2024 | $3,694 | $218,614 | $43,714 | $174,900 |
| 2023 | $3,655 | $214,328 | $42,857 | $171,471 |
| 2022 | $3,592 | $210,126 | $42,017 | $168,109 |
| 2021 | $3,516 | $206,007 | $41,194 | $164,813 |
| 2019 | $3,426 | $199,899 | $39,973 | $159,926 |
| 2018 | $3,375 | $195,981 | $39,190 | $156,791 |
| 2016 | $3,198 | $188,372 | $37,669 | $150,703 |
| 2015 | $3,159 | $185,544 | $37,104 | $148,440 |
| 2014 | $3,151 | $181,911 | $36,378 | $145,533 |
Source: Public Records
Map
Nearby Homes
- 3046 Hampton Rd
- 0 Vac Vic 195 Ste Ave U8 Unit 26657427
- 3160 Crowne Dr
- 2748 Bouquet Ln
- 39221 Beacon Ln
- 3134 Dearborn Ave
- 2844 Brookhurst Ct
- 39317 Beacon Ln
- 39329 Beacon Ln
- 0 Rd Vic 80th Vac Elizabath Lake
- 39451 Beacon Ln
- 39434 Basalt Ct
- 2709 Sandstone Ct
- 2856 Cloverdale Ct
- 0 High Springs Rd Unit SR25173945
- 20 Street West & Ave S
- 18 St West and Ave S
- 0 Vac Vic Desert Springs Ave Unit SR18269051
- 514 Vac Vic Lakeview Dr Tierra Sub
- 18 Street West and Ave S
- 3038 Regency Way
- 3024 Regency Way
- 3029 Wellington Dr
- 3035 Wellington Dr
- 3021 Wellington Dr
- 3044 Regency Way
- 3041 Wellington Dr
- 3029 Regency Way
- 3021 Regency Way
- 3050 Regency Way
- 39306 Landmark Ct
- 3049 Wellington Dr
- 3015 Regency Way
- 39258 Harvard Ln
- 39252 Harvard Ln
- 3100 Regency Way
- 39312 Landmark Ct
- 36841 Bouquet Ln
- 3030 Crowne Dr
- 3030 Wellington Dr
Your Personal Tour Guide
Ask me questions while you tour the home.