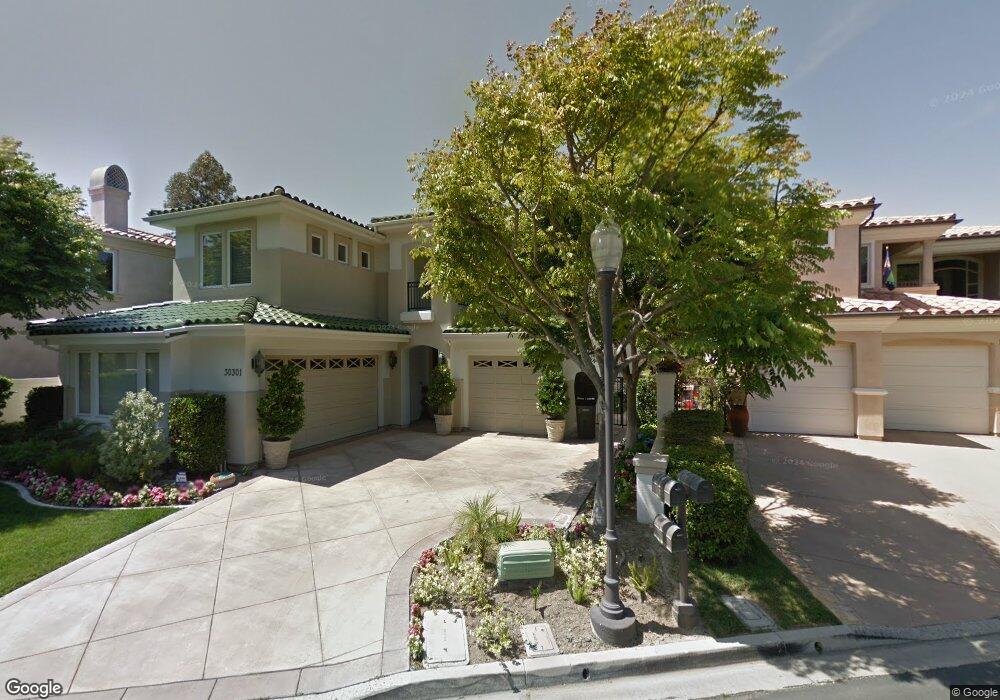
30301 Via Festivo San Juan Capistrano, CA 92675
Estimated Value: $3,085,425 - $3,779,000
5
Beds
6
Baths
4,457
Sq Ft
$751/Sq Ft
Est. Value
About This Home
This home is located at 30301 Via Festivo, San Juan Capistrano, CA 92675 and is currently estimated at $3,345,856, approximately $750 per square foot. 30301 Via Festivo is a home located in Orange County with nearby schools including Harold Ambuehl Elementary School, Marco Forster Middle School, and San Juan Hills High School.
Ownership History
Date
Name
Owned For
Owner Type
Purchase Details
Closed on
Aug 18, 2021
Sold by
Huish Carolyn B
Bought by
Huish Carolyn B and Carolyn B Huish Trust
Current Estimated Value
Purchase Details
Closed on
May 4, 2001
Sold by
Nm Homes One Inc
Bought by
Huish Carolyn B
Home Financials for this Owner
Home Financials are based on the most recent Mortgage that was taken out on this home.
Original Mortgage
$999,200
Interest Rate
6.75%
Purchase Details
Closed on
Sep 16, 1998
Sold by
Clark Jody Anne
Bought by
Nm Homes Inc
Purchase Details
Closed on
Sep 30, 1997
Sold by
Clark Jody Anne
Bought by
Clark Jody Anne and 1997 Jody Anne Clark Revocable Living Tr
Purchase Details
Closed on
May 6, 1997
Sold by
Skk Partnership Ltd
Bought by
Clark Jody A
Create a Home Valuation Report for This Property
The Home Valuation Report is an in-depth analysis detailing your home's value as well as a comparison with similar homes in the area
Home Values in the Area
Average Home Value in this Area
Purchase History
| Date | Buyer | Sale Price | Title Company |
|---|---|---|---|
| Huish Carolyn B | -- | None Available | |
| Huish Carolyn B | $1,249,000 | Orange Coast Title Company | |
| Nm Homes Inc | $425,000 | Chicago Title Co | |
| Clark Jody Anne | -- | -- | |
| Clark Jody A | $287,500 | First American Title |
Source: Public Records
Mortgage History
| Date | Status | Borrower | Loan Amount |
|---|---|---|---|
| Previous Owner | Huish Carolyn B | $999,200 |
Source: Public Records
Tax History Compared to Growth
Tax History
| Year | Tax Paid | Tax Assessment Tax Assessment Total Assessment is a certain percentage of the fair market value that is determined by local assessors to be the total taxable value of land and additions on the property. | Land | Improvement |
|---|---|---|---|---|
| 2025 | $19,730 | $1,927,560 | $916,172 | $1,011,388 |
| 2024 | $19,730 | $1,889,765 | $898,208 | $991,557 |
| 2023 | $19,268 | $1,852,711 | $880,596 | $972,115 |
| 2022 | $18,649 | $1,816,384 | $863,330 | $953,054 |
| 2021 | $18,305 | $1,780,769 | $846,402 | $934,367 |
| 2020 | $18,142 | $1,762,510 | $837,723 | $924,787 |
| 2019 | $17,805 | $1,727,951 | $821,297 | $906,654 |
| 2018 | $17,484 | $1,694,070 | $805,193 | $888,877 |
| 2017 | $16,914 | $1,621,638 | $789,405 | $832,233 |
| 2016 | $16,602 | $1,589,842 | $773,927 | $815,915 |
| 2015 | $16,348 | $1,565,962 | $762,302 | $803,660 |
| 2014 | $16,059 | $1,535,287 | $747,369 | $787,918 |
Source: Public Records
Map
Nearby Homes
- 30431 Via Festivo
- 27821 Golden Ridge Ln
- 30372 Marbella Vista
- 27972 Golden Ridge Ln
- 27971 Golden Ridge Ln
- 27591 Rolling Wood Ln
- 27281 Viewpoint Cir
- 30532 Marbella Vista
- 27946 Suffolk Ln
- 27962 Suffolk Ln
- 27703 Ortega Hwy Unit 13
- 27703 Ortega Hwy Unit 127
- 30932 Steeplechase Dr
- 70 Plaza Cuesta
- 90 Plaza de Las Flores
- 1 David St
- 30967 Steeplechase Dr
- 30671 Marbella Vista
- 15 Pisano St
- 10 Gaucho Rd
- 30291 Via Festivo
- 30311 Via Festivo
- 30321 Via Festivo
- 30281 Via Festivo
- 30282 Via Festivo
- 30331 Via Festivo
- 30271 Via Festivo
- 30261 Via Festivo
- 30341 Via Festivo
- 30251 Via Festivo
- 30351 Via Festivo
- 27712 Somerset Ln
- 30211 Marbella Vista
- 30312 Via Festivo
- 30361 Via Festivo
- 30241 Via Festivo
- 30252 Marbella Vista
- 30221 Marbella Vista
- 30342 Via Festivo
- 27736 Somerset Ln