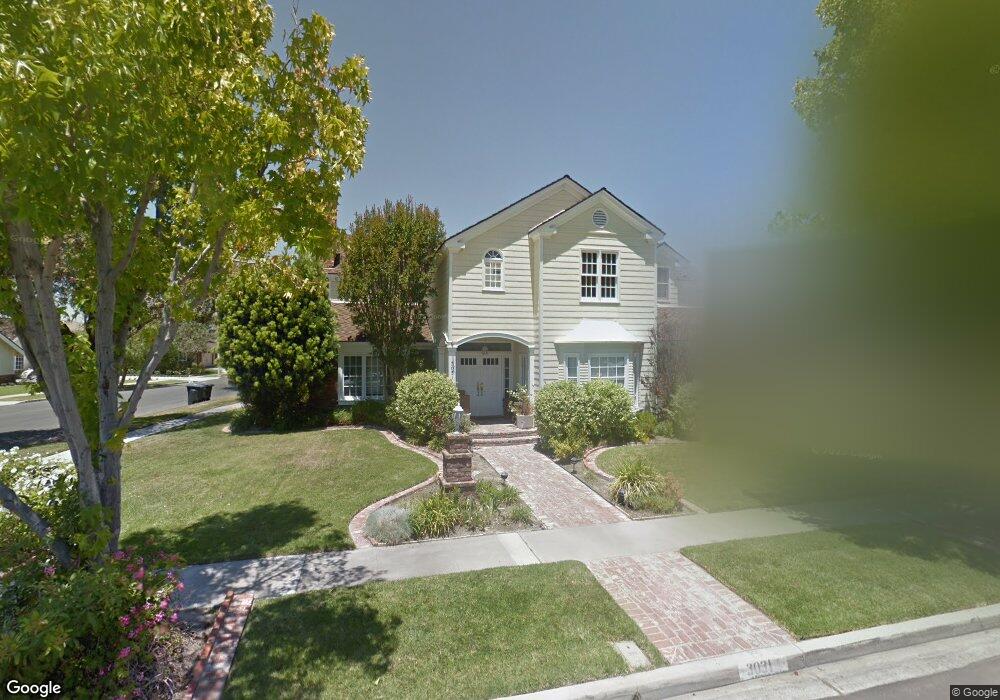
3031 Burney Place Los Alamitos, CA 90720
Rossmoor NeighborhoodEstimated Value: $2,210,000 - $2,601,000
5
Beds
5
Baths
3,912
Sq Ft
$630/Sq Ft
Est. Value
About This Home
This home is located at 3031 Burney Place, Los Alamitos, CA 90720 and is currently estimated at $2,464,550, approximately $629 per square foot. 3031 Burney Place is a home located in Orange County with nearby schools including Richard Henry Lee Elementary School, Jack L. Weaver Elementary School, and Oak Middle School.
Ownership History
Date
Name
Owned For
Owner Type
Purchase Details
Closed on
Dec 9, 2011
Sold by
Coppersmith Brian J and Coppersmith Amanda
Bought by
Coppersmith Brian J and Coppersmith Amanda
Current Estimated Value
Purchase Details
Closed on
Sep 7, 2005
Sold by
Coppersmith Mike M
Bought by
Coppersmith Brian J and Coppersmith Amanda
Purchase Details
Closed on
Apr 8, 2002
Sold by
Coppersmith Mike M and Coppersmith Carole N
Bought by
Coppersmith Michael M and Coppersmith Carole N
Home Financials for this Owner
Home Financials are based on the most recent Mortgage that was taken out on this home.
Original Mortgage
$575,000
Interest Rate
7.08%
Purchase Details
Closed on
Apr 5, 2000
Sold by
Michael Coppersmith and Michael Carole
Bought by
Coppersmith Mike M and Coppersmith Carole N
Create a Home Valuation Report for This Property
The Home Valuation Report is an in-depth analysis detailing your home's value as well as a comparison with similar homes in the area
Home Values in the Area
Average Home Value in this Area
Purchase History
| Date | Buyer | Sale Price | Title Company |
|---|---|---|---|
| Coppersmith Brian J | -- | None Available | |
| Coppersmith Brian J | -- | -- | |
| Coppersmith Michael M | -- | North American Title Co | |
| Coppersmith Mike M | -- | -- |
Source: Public Records
Mortgage History
| Date | Status | Borrower | Loan Amount |
|---|---|---|---|
| Previous Owner | Coppersmith Michael M | $575,000 |
Source: Public Records
Tax History Compared to Growth
Tax History
| Year | Tax Paid | Tax Assessment Tax Assessment Total Assessment is a certain percentage of the fair market value that is determined by local assessors to be the total taxable value of land and additions on the property. | Land | Improvement |
|---|---|---|---|---|
| 2025 | $15,316 | $1,370,485 | $873,242 | $497,243 |
| 2024 | $15,316 | $1,343,613 | $856,119 | $487,494 |
| 2023 | $14,974 | $1,317,268 | $839,332 | $477,936 |
| 2022 | $14,930 | $1,291,440 | $822,875 | $468,565 |
| 2021 | $14,607 | $1,266,118 | $806,740 | $459,378 |
| 2020 | $14,668 | $1,253,136 | $798,468 | $454,668 |
| 2019 | $14,192 | $1,228,565 | $782,812 | $445,753 |
| 2018 | $13,606 | $1,204,476 | $767,463 | $437,013 |
| 2017 | $13,322 | $1,180,859 | $752,414 | $428,445 |
| 2016 | $13,069 | $1,157,705 | $737,660 | $420,045 |
| 2015 | $12,954 | $1,140,316 | $726,580 | $413,736 |
| 2014 | $12,504 | $1,117,979 | $712,347 | $405,632 |
Source: Public Records
Map
Nearby Homes
- 11385 Baskerville Rd
- 3312 Kenilworth Dr
- 11741 Foster Rd
- 11291 Wembley Rd
- 3311 Rossmoor Way
- 3361 Rossmoor Way
- 3272 Saint Albans Dr
- 2872 Aceca Dr
- 3391 Rossmoor Way
- 3122 Ruth Elaine Dr
- 3362 Saint Albans Dr
- 11862 Paseo Bonita
- 12100 Montecito Rd Unit 49
- 3701 La Colmena Way
- 3342 Bradbury Rd Unit 34
- 12200 Montecito Rd Unit K201
- 12200 Montecito Rd
- 12200 Montecito Rd Unit A205
- 12200 Montecito Rd Unit C103
- 12300 Montecito Rd Unit 13
- 3051 Burney Place
- 11502 Baskerville Rd
- 11541 Baskerville Rd
- 3071 Burney Place
- 11521 Baskerville Rd
- 11561 Baskerville Rd
- 3032 Burney Place
- 11482 Baskerville Rd
- 3052 Burney Place
- 11501 Baskerville Rd
- 3132 Shakespeare Dr
- 11571 Baskerville Rd
- 3081 Burney Place
- 3072 Burney Place
- 3152 Shakespeare Dr
- 11512 Donovan Rd
- 11532 Donovan Rd
- 11492 Donovan Rd
- 11581 Baskerville Rd
- 3082 Burney Place