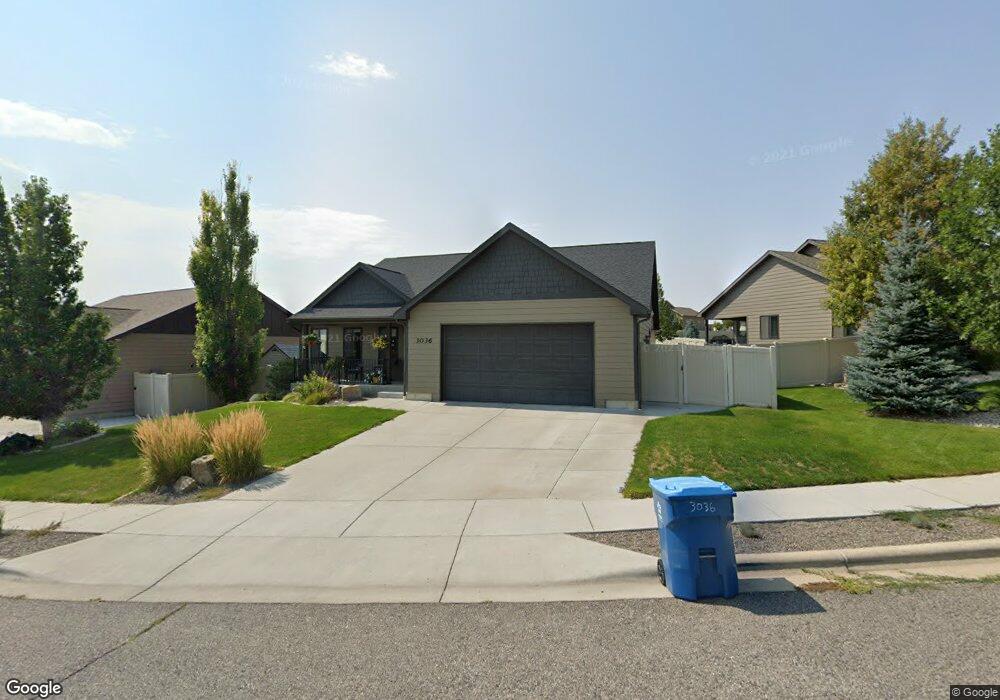
3036 E Copper Ridge Loop Billings, MT 59106
West Shiloh NeighborhoodEstimated Value: $418,000 - $515,000
5
Beds
2
Baths
3,008
Sq Ft
$153/Sq Ft
Est. Value
About This Home
This home is located at 3036 E Copper Ridge Loop, Billings, MT 59106 and is currently estimated at $461,330, approximately $153 per square foot. 3036 E Copper Ridge Loop is a home with nearby schools including Boulder School, Ben Steele Middle School, and Billings West High School.
Ownership History
Date
Name
Owned For
Owner Type
Purchase Details
Closed on
Apr 5, 2021
Sold by
Yarina Michael J and Yarina Brenna L
Bought by
Holden Max E and Holden Alicia A
Current Estimated Value
Home Financials for this Owner
Home Financials are based on the most recent Mortgage that was taken out on this home.
Original Mortgage
$264,000
Outstanding Balance
$236,525
Interest Rate
2.8%
Mortgage Type
New Conventional
Estimated Equity
$224,805
Purchase Details
Closed on
Oct 20, 2011
Sold by
Bob Pentecost Construction Inc
Bought by
Yarina Michael J and Yarina Brenna L
Home Financials for this Owner
Home Financials are based on the most recent Mortgage that was taken out on this home.
Original Mortgage
$227,482
Interest Rate
4.02%
Mortgage Type
VA
Purchase Details
Closed on
Jul 29, 2011
Sold by
Copper Ridge Development Corporation
Bought by
Bob Pentecoast Construction Inc
Create a Home Valuation Report for This Property
The Home Valuation Report is an in-depth analysis detailing your home's value as well as a comparison with similar homes in the area
Home Values in the Area
Average Home Value in this Area
Purchase History
| Date | Buyer | Sale Price | Title Company |
|---|---|---|---|
| Holden Max E | -- | Chicago Title | |
| Yarina Michael J | -- | None Available | |
| Bob Pentecoast Construction Inc | -- | Chicago Title |
Source: Public Records
Mortgage History
| Date | Status | Borrower | Loan Amount |
|---|---|---|---|
| Open | Holden Max E | $264,000 | |
| Previous Owner | Yarina Michael J | $227,482 |
Source: Public Records
Tax History
| Year | Tax Paid | Tax Assessment Tax Assessment Total Assessment is a certain percentage of the fair market value that is determined by local assessors to be the total taxable value of land and additions on the property. | Land | Improvement |
|---|---|---|---|---|
| 2025 | $4,229 | $457,500 | $74,713 | $382,787 |
| 2024 | $4,229 | $408,500 | $65,393 | $343,107 |
| 2023 | $4,173 | $408,500 | $65,393 | $343,107 |
| 2022 | $3,110 | $329,400 | $0 | $0 |
| 2021 | $3,575 | $329,400 | $0 | $0 |
| 2020 | $3,417 | $300,500 | $0 | $0 |
| 2019 | $3,275 | $300,500 | $0 | $0 |
| 2018 | $3,428 | $291,000 | $0 | $0 |
| 2017 | $2,693 | $291,000 | $0 | $0 |
| 2016 | $3,032 | $269,000 | $0 | $0 |
| 2015 | $2,957 | $269,000 | $0 | $0 |
| 2014 | $2,768 | $132,659 | $0 | $0 |
Source: Public Records
Map
Nearby Homes
- 3020 E Copper Ridge Loop
- 3024 Western Bluffs Blvd
- 3342 Lucky Penny Ln
- 637 Willow Branch Rd
- 635 Willow Branch Rd
- 3354 Lucky Penny Ln
- 3132 Harrier Ln
- 3039 Golden Acres Dr
- 2941 Eagle Butte Tr
- 6421 Southern Bluffs Unit #1 Ln
- 6421 Southern Bluffs Ln Unit 2
- 6862 Copper Ridge Loop
- 2981 W Copper Ridge Loop
- 1328 Medinah Place
- 6333 Stream Bank
- 4720 Twisted Pine
- 6324 Tawny Bluff
- 4714 Twisted Pine
- 6328 Tawny Bluff
- 4715 Twisted Pine
- 3034 E Copper Ridge Loop
- 3042 E Copper Ridge Loop
- 3026 E Copper Ridge Loop
- 3037 E Copper Ridge Loop
- 3102 E Copper Ridge Loop
- 3041 E Copper Ridge Loop
- 3035 E Copper Ridge Loop
- 3039 E Copper Ridge Loop
- 3022 E Copper Ridge Loop
- 3033 E Copper Ridge Loop
- 3104 E Copper Ridge Loop
- 3031 E Copper Ridge Loop
- 3029 E Copper Ridge Loop
- 3101 E Copper Ridge Loop
- 3108 E Copper Ridge Loop
- 3103 Copper Ridge Place
- 3018 E Copper Ridge Loop
- 3027 E Copper Ridge Loop
- 3103 E Copper Ridge Loop
- 3102 Amelia Cir
Your Personal Tour Guide
Ask me questions while you tour the home.