3038 153rd St Flushing, NY 11354
Murray Hill-Broadway NeighborhoodEstimated Value: $1,518,000 - $2,316,000
Studio
--
Bath
3,092
Sq Ft
$595/Sq Ft
Est. Value
About This Home
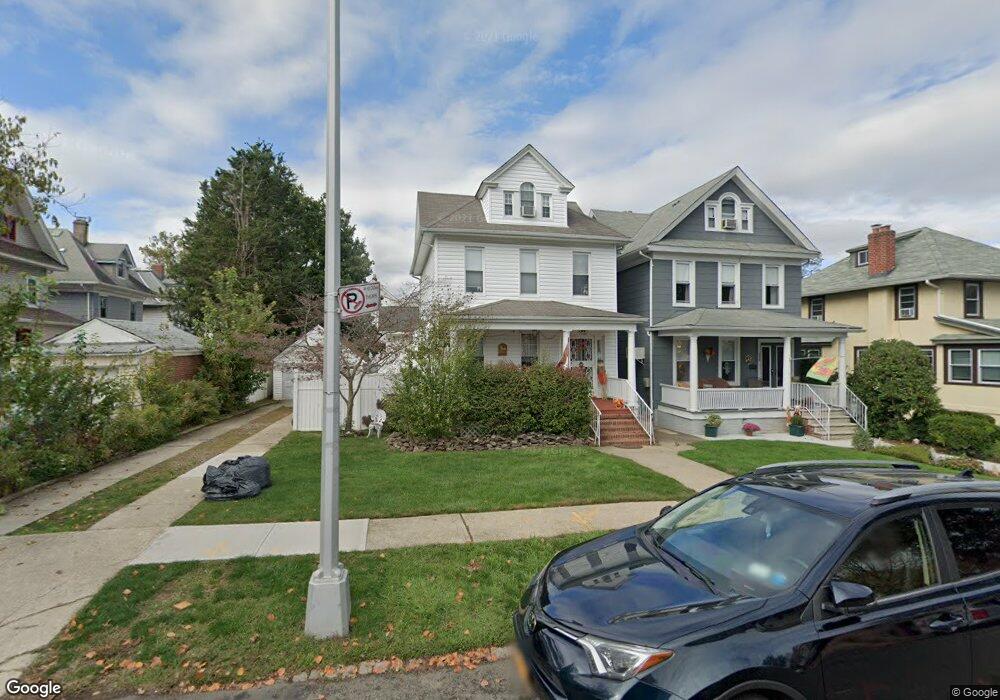
This home is located at 3038 153rd St, Flushing, NY 11354 and is currently estimated at $1,840,333, approximately $595 per square foot. 3038 153rd St is a home located in Queens County with nearby schools including P.S. 21 Edward Hart, Jhs 185 Edward Bleeker, and Flushing High School.
Ownership History
Date
Name
Owned For
Owner Type
Purchase Details
Closed on
Feb 16, 2022
Sold by
O'Donnell Theresa
Bought by
Li Xiuying and Zeng Guo Shi
Current Estimated Value
Home Financials for this Owner
Home Financials are based on the most recent Mortgage that was taken out on this home.
Original Mortgage
$597,000
Outstanding Balance
$552,242
Interest Rate
3.55%
Mortgage Type
Purchase Money Mortgage
Estimated Equity
$1,288,091
Purchase Details
Closed on
Dec 3, 2019
Sold by
O'Donnell Patrick and O'Donnell Theresa
Bought by
O'Donnell Theresa
Purchase Details
Closed on
Dec 4, 1998
Sold by
Biancospino Louis and Biancospino Rosemarie
Bought by
Odonnell Patrick and Odonnell Theresa
Home Financials for this Owner
Home Financials are based on the most recent Mortgage that was taken out on this home.
Original Mortgage
$227,150
Interest Rate
6.8%
Mortgage Type
Purchase Money Mortgage
Create a Home Valuation Report for This Property
The Home Valuation Report is an in-depth analysis detailing your home's value as well as a comparison with similar homes in the area
Home Values in the Area
Average Home Value in this Area
Purchase History
| Date | Buyer | Sale Price | Title Company |
|---|---|---|---|
| Li Xiuying | $995,000 | -- | |
| Li Xiuying | $995,000 | -- | |
| Li Xiuying | $995,000 | -- | |
| O'Donnell Theresa | -- | -- | |
| O'Donnell Theresa | -- | -- | |
| O'Donnell Theresa | -- | -- | |
| Odonnell Patrick | $285,000 | -- | |
| Odonnell Patrick | $285,000 | -- |
Source: Public Records
Mortgage History
| Date | Status | Borrower | Loan Amount |
|---|---|---|---|
| Open | Li Xiuying | $597,000 | |
| Closed | Li Xiuying | $597,000 | |
| Previous Owner | Odonnell Patrick | $227,150 |
Source: Public Records
Tax History
| Year | Tax Paid | Tax Assessment Tax Assessment Total Assessment is a certain percentage of the fair market value that is determined by local assessors to be the total taxable value of land and additions on the property. | Land | Improvement |
|---|---|---|---|---|
| 2025 | $7,532 | $76,620 | $23,161 | $53,459 |
| 2024 | $7,532 | $37,500 | $23,310 | $14,190 |
| 2023 | $4,519 | $22,500 | $22,500 | $0 |
| 2022 | $8,592 | $106,080 | $46,020 | $60,060 |
| 2021 | $8,446 | $65,340 | $19,380 | $45,960 |
| 2020 | $6,461 | $62,280 | $19,380 | $42,900 |
| 2019 | $6,161 | $53,340 | $19,380 | $33,960 |
| 2018 | $5,636 | $29,107 | $10,957 | $18,150 |
| 2017 | $5,342 | $27,676 | $11,050 | $16,626 |
| 2016 | $5,008 | $27,676 | $11,050 | $16,626 |
| 2015 | $2,929 | $26,600 | $13,740 | $12,860 |
| 2014 | $2,929 | $25,711 | $11,972 | $13,739 |
Source: Public Records
Map
Nearby Homes
- 153-06 32nd Ave
- 3307 153rd St
- 32-20 156th St
- 151-10 33rd Ave
- 32-15 Murray Ln
- 33-19 155th St
- 33-38 153rd St
- 151-08 33rd Rd
- 30-27 Murray Ln
- 32-24 157th St
- 3226 158th St
- 28-14 157th St
- 154-09 35th Ave
- 15428 27th Ave
- 154-28 27th Ave
- 151-67 27th Ave
- 3425 150th Place Unit 4D
- 3425 150th Place Unit 6E
- 34-25 150th Place Unit 3E
- 154-24 27th Ave
Your Personal Tour Guide
Ask me questions while you tour the home.