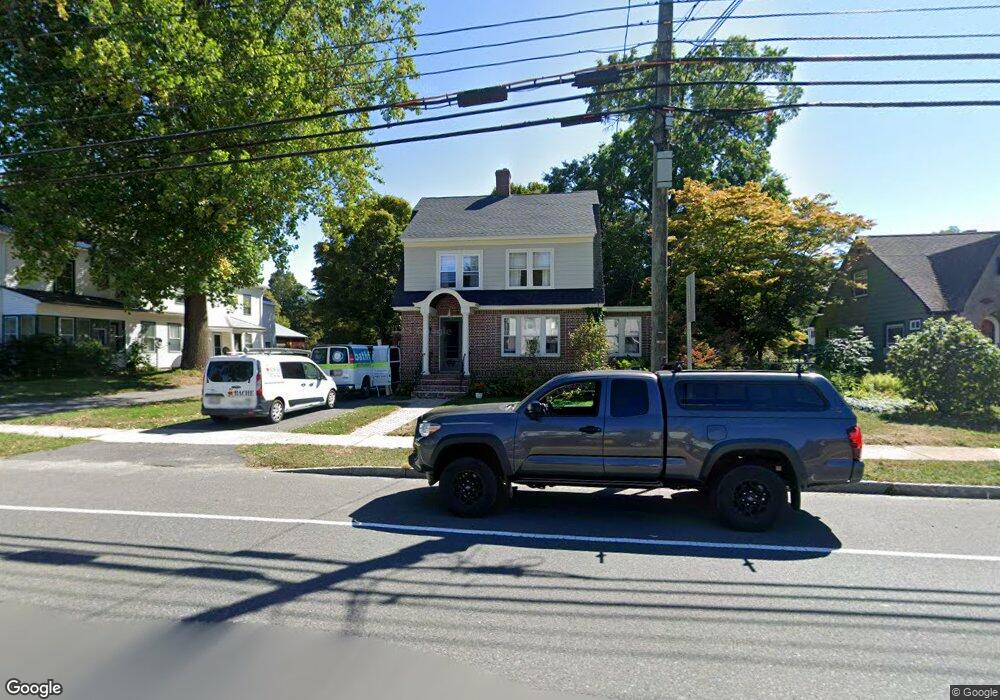
304 Main St Easthampton, MA 01027
Estimated Value: $451,000 - $524,000
3
Beds
2
Baths
1,654
Sq Ft
$295/Sq Ft
Est. Value
About This Home
This home is located at 304 Main St, Easthampton, MA 01027 and is currently estimated at $487,369, approximately $294 per square foot. 304 Main St is a home located in Hampshire County with nearby schools including Easthampton High School, Hilltown Cooperative Charter Public School, and Calvary Baptist Christian School.
Ownership History
Date
Name
Owned For
Owner Type
Purchase Details
Closed on
Jul 1, 2014
Sold by
Brouillette Paul A
Bought by
Brouillette Paul A and Antoniuk Kristina
Current Estimated Value
Purchase Details
Closed on
Aug 30, 2002
Sold by
Hebert Denise J and Tanguay Denise J
Bought by
Brouillette Paul A
Home Financials for this Owner
Home Financials are based on the most recent Mortgage that was taken out on this home.
Original Mortgage
$70,000
Interest Rate
6.55%
Mortgage Type
Purchase Money Mortgage
Purchase Details
Closed on
Nov 12, 1993
Sold by
Zovorski Thomas and Zovorski Marilyn
Bought by
Tanguay Raymond G and Tanguay Denise J
Home Financials for this Owner
Home Financials are based on the most recent Mortgage that was taken out on this home.
Original Mortgage
$85,953
Interest Rate
6.79%
Mortgage Type
Purchase Money Mortgage
Create a Home Valuation Report for This Property
The Home Valuation Report is an in-depth analysis detailing your home's value as well as a comparison with similar homes in the area
Home Values in the Area
Average Home Value in this Area
Purchase History
| Date | Buyer | Sale Price | Title Company |
|---|---|---|---|
| Brouillette Paul A | -- | -- | |
| Brouillette Paul A | $157,000 | -- | |
| Tanguay Raymond G | $85,900 | -- |
Source: Public Records
Mortgage History
| Date | Status | Borrower | Loan Amount |
|---|---|---|---|
| Previous Owner | Tanguay Raymond G | $96,000 | |
| Previous Owner | Tanguay Raymond G | $52,000 | |
| Previous Owner | Tanguay Raymond G | $70,000 | |
| Previous Owner | Tanguay Raymond G | $85,953 |
Source: Public Records
Tax History Compared to Growth
Tax History
| Year | Tax Paid | Tax Assessment Tax Assessment Total Assessment is a certain percentage of the fair market value that is determined by local assessors to be the total taxable value of land and additions on the property. | Land | Improvement |
|---|---|---|---|---|
| 2025 | $5,177 | $378,700 | $104,200 | $274,500 |
| 2024 | $4,990 | $368,000 | $101,100 | $266,900 |
| 2023 | $3,749 | $255,900 | $79,800 | $176,100 |
| 2022 | $4,230 | $255,900 | $79,800 | $176,100 |
| 2021 | $4,655 | $265,400 | $79,800 | $185,600 |
| 2020 | $4,545 | $255,900 | $79,800 | $176,100 |
| 2019 | $3,899 | $252,200 | $79,800 | $172,400 |
| 2018 | $3,750 | $234,400 | $75,300 | $159,100 |
| 2017 | $3,660 | $225,800 | $72,400 | $153,400 |
| 2016 | $3,498 | $224,400 | $72,400 | $152,000 |
| 2015 | $3,400 | $224,400 | $72,400 | $152,000 |
Source: Public Records
Map
Nearby Homes
- 385 Main St
- 41 South St Unit 11
- 125 Park St
- M143 &152 Glendale St
- 6 S St & Abutting Lots
- 52 Williston Ave
- 5 Lownds Ave
- 2 Little St
- 38 West St
- 19 Nicols Way Unit 19
- 33 Howard Ave
- 245 Park St
- 12 Kingsberry Ln
- 33 Knipfer Ave
- 16 Bayberry Dr
- 78 Holyoke St
- 52-54 Everett St
- 38 College Hwy
- 98 Everett St
- 4 Laurel Dr