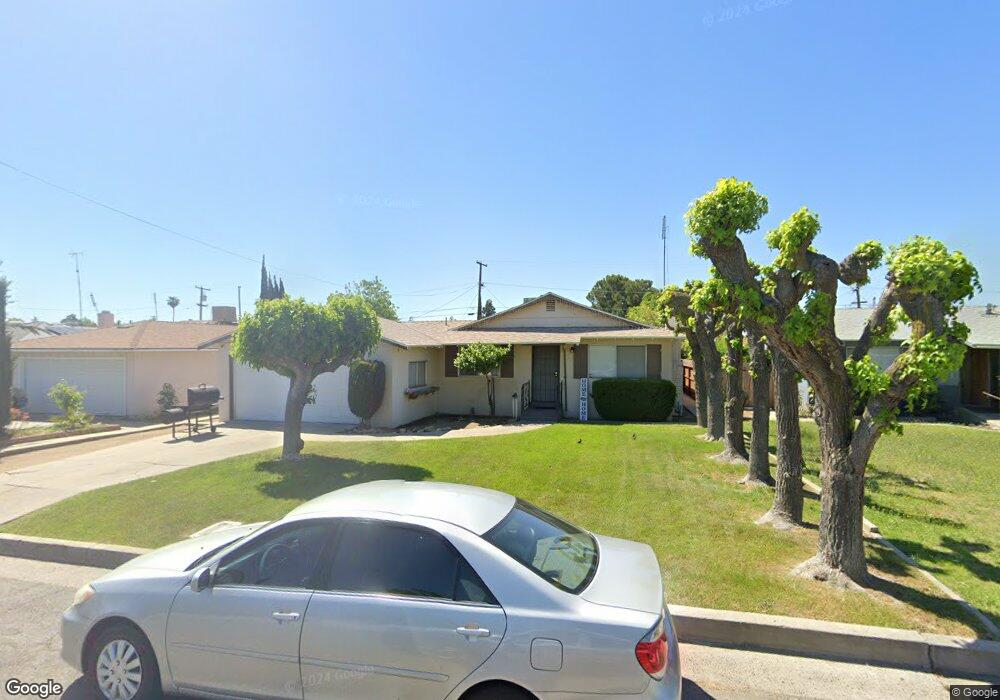
304 Maple St Madera, CA 93637
West Madera NeighborhoodEstimated Value: $297,000 - $316,866
3
Beds
2
Baths
1,120
Sq Ft
$277/Sq Ft
Est. Value
About This Home
This home is located at 304 Maple St, Madera, CA 93637 and is currently estimated at $310,217, approximately $276 per square foot. 304 Maple St is a home located in Madera County with nearby schools including James Madison Elementary School, Thomas Jefferson Middle School, and Madera High School.
Ownership History
Date
Name
Owned For
Owner Type
Purchase Details
Closed on
Jun 13, 2005
Sold by
Chavira Mary S
Bought by
Hooks Shawn
Current Estimated Value
Home Financials for this Owner
Home Financials are based on the most recent Mortgage that was taken out on this home.
Original Mortgage
$188,000
Outstanding Balance
$97,008
Interest Rate
5.58%
Mortgage Type
Fannie Mae Freddie Mac
Estimated Equity
$213,209
Purchase Details
Closed on
Aug 24, 2004
Sold by
Sanchez Manuel S and Sanchez Lupe D
Bought by
Chavira Mary S
Create a Home Valuation Report for This Property
The Home Valuation Report is an in-depth analysis detailing your home's value as well as a comparison with similar homes in the area
Home Values in the Area
Average Home Value in this Area
Purchase History
| Date | Buyer | Sale Price | Title Company |
|---|---|---|---|
| Hooks Shawn | $235,000 | Chicago Title | |
| Chavira Mary S | -- | -- |
Source: Public Records
Mortgage History
| Date | Status | Borrower | Loan Amount |
|---|---|---|---|
| Open | Hooks Shawn | $188,000 |
Source: Public Records
Tax History
| Year | Tax Paid | Tax Assessment Tax Assessment Total Assessment is a certain percentage of the fair market value that is determined by local assessors to be the total taxable value of land and additions on the property. | Land | Improvement |
|---|---|---|---|---|
| 2025 | $3,231 | $272,500 | $40,000 | $232,500 |
| 2023 | $3,231 | $272,500 | $40,000 | $232,500 |
| 2022 | $2,620 | $227,000 | $40,000 | $187,000 |
| 2021 | $2,085 | $180,000 | $30,000 | $150,000 |
| 2020 | $1,998 | $167,549 | $55,612 | $111,937 |
| 2019 | $1,928 | $159,571 | $52,964 | $106,607 |
| 2018 | $1,682 | $147,751 | $49,041 | $98,710 |
| 2017 | $1,615 | $140,716 | $46,706 | $94,010 |
| 2016 | $1,531 | $134,015 | $44,482 | $89,533 |
| 2015 | $1,499 | $132,002 | $43,814 | $88,188 |
| 2014 | $1,428 | $132,002 | $43,814 | $88,188 |
Source: Public Records
Map
Nearby Homes
- 300 Walnut St
- 119 Santa Cruz St
- 109 W Lewis St
- 435 Blueridge Dr
- 601 Oakridge Dr
- 311 Stadium Rd
- 718 Gamay Ave
- 412 S K St
- 710 S G St
- 313 S K St
- 1050 Monterey St
- 724 S Gateway Dr
- 568 St Julien Dr
- 635 St Julien Dr
- 1176 Seneca Dr
- 1583 Seneca Dr
- 1228 Monterey St
- 1228 Monterey Ave
- 300 S Gateway Dr
- 724 W Yosemite Ave
Your Personal Tour Guide
Ask me questions while you tour the home.