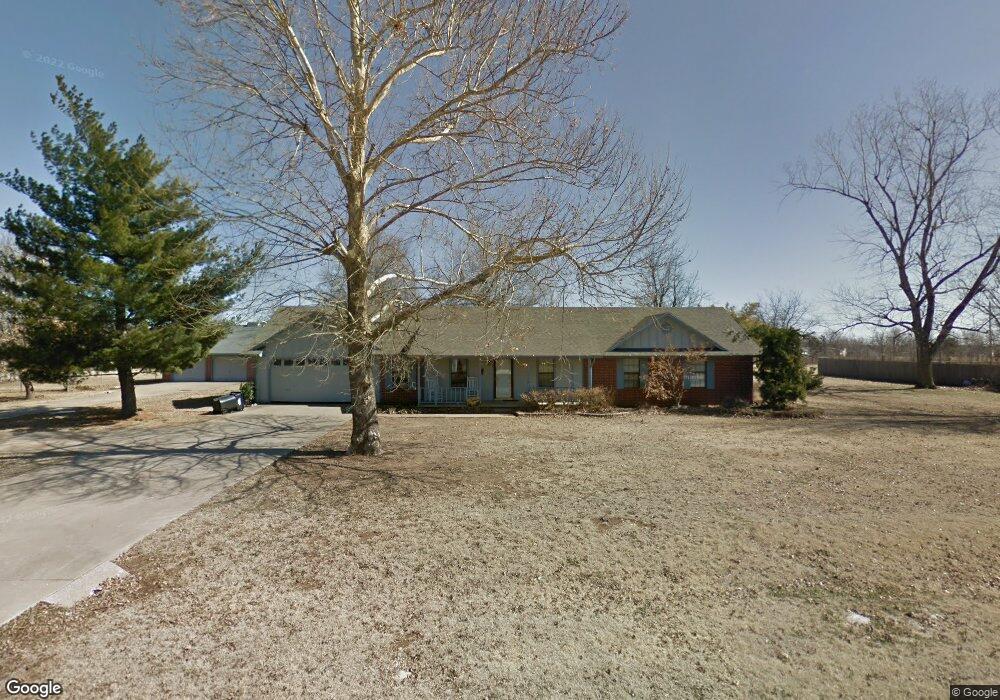
304 N Will Rogers Loop E Oologah, OK 74053
Estimated Value: $260,000 - $462,000
4
Beds
2
Baths
1,874
Sq Ft
$181/Sq Ft
Est. Value
About This Home
This home is located at 304 N Will Rogers Loop E, Oologah, OK 74053 and is currently estimated at $339,895, approximately $181 per square foot. 304 N Will Rogers Loop E is a home located in Rogers County with nearby schools including Oologah-Talala Lower Elementary School, Oologah-Talala Upper Elementary School, and Oologah-Talala Middle School.
Ownership History
Date
Name
Owned For
Owner Type
Purchase Details
Closed on
Oct 10, 2017
Sold by
Barker Albert L and Barker Betty L
Bought by
Grudier Ronnie W and Grudier Cheryl L
Current Estimated Value
Home Financials for this Owner
Home Financials are based on the most recent Mortgage that was taken out on this home.
Original Mortgage
$186,558
Outstanding Balance
$156,037
Interest Rate
3.87%
Mortgage Type
FHA
Estimated Equity
$183,858
Purchase Details
Closed on
Sep 11, 2014
Sold by
Schovanec Sonny
Bought by
Barker Albert L and Barker Betty L
Purchase Details
Closed on
May 13, 2005
Sold by
Hardison Mark
Bought by
Schovanec Sonny and Schovance Stacey L
Home Financials for this Owner
Home Financials are based on the most recent Mortgage that was taken out on this home.
Original Mortgage
$133,941
Interest Rate
5.92%
Mortgage Type
FHA
Create a Home Valuation Report for This Property
The Home Valuation Report is an in-depth analysis detailing your home's value as well as a comparison with similar homes in the area
Home Values in the Area
Average Home Value in this Area
Purchase History
| Date | Buyer | Sale Price | Title Company |
|---|---|---|---|
| Grudier Ronnie W | $190,000 | Allegiance Title & Escrow Ll | |
| Barker Albert L | $170,000 | -- | |
| Schovanec Sonny | $135,000 | Scott Title & Escrow Co Inc |
Source: Public Records
Mortgage History
| Date | Status | Borrower | Loan Amount |
|---|---|---|---|
| Open | Grudier Ronnie W | $186,558 | |
| Previous Owner | Schovanec Sonny | $133,941 |
Source: Public Records
Tax History Compared to Growth
Tax History
| Year | Tax Paid | Tax Assessment Tax Assessment Total Assessment is a certain percentage of the fair market value that is determined by local assessors to be the total taxable value of land and additions on the property. | Land | Improvement |
|---|---|---|---|---|
| 2024 | $2,109 | $21,003 | $2,844 | $18,159 |
| 2023 | $2,109 | $20,391 | $1,760 | $18,631 |
| 2022 | $2,093 | $21,085 | $2,200 | $18,885 |
| 2021 | $2,131 | $21,344 | $2,200 | $19,144 |
| 2020 | $2,098 | $20,982 | $2,200 | $18,782 |
| 2019 | $1,996 | $20,091 | $2,200 | $17,891 |
| 2018 | $2,153 | $20,912 | $2,200 | $18,712 |
| 2017 | $2,147 | $18,881 | $2,063 | $16,818 |
| 2016 | $1,907 | $18,418 | $2,063 | $16,355 |
| 2015 | $1,748 | $17,870 | $2,063 | $15,807 |
| 2014 | $1,583 | $16,183 | $1,650 | $14,533 |
Source: Public Records
Map
Nearby Homes
- 7425 E Oologah Place
- 002 Highway 169
- 7 E 420
- 0 S Pine St
- 225 S Locust St
- 213 E Sunday Ave
- 226 Price Ave
- S S 4110 Rd
- 000 HWY 88
- 20 S 4110 Rd
- 000 S 4110 Rd
- 12123 S 4090 Rd
- 1130 S Will Rogers Dr
- 1112 S Marina Dr
- 1122 S Catalina Dr
- 5950 E Everetts Point
- 9705 E Redbud St
- 0 E 360 Rd Unit 2542530
- 13192 S Hickory St
- 13525 S Grande Pointe Pkwy
- 304 N Will Rogers Loop E
- 304 N Will Rogers Loop E N A
- 208 N Will Rogers Loop E
- 211 N Will Rogers Loop E
- 305 N Will Rogers Loop E
- 306 Will Rogers Loop E
- 211 N Will Rogers Loop E
- 206 N Will Rogers Loop E
- 400 Will Rogers Loop E
- 209 N Will Rogers Loop E
- 405 Will Rogers Loop E
- 400 N Will Rogers Loop E
- 206 Will Rogers Loop E
- 302 Will Rogers Loop W
- 212 Will Rogers Loop W
- 7250 E 390 Rd
- 406 N Will Rogers Loop E
- 407 Will Rogers Loop E
- 204 N Will Rogers Loop E
- 210 N Will Rogers Loop W