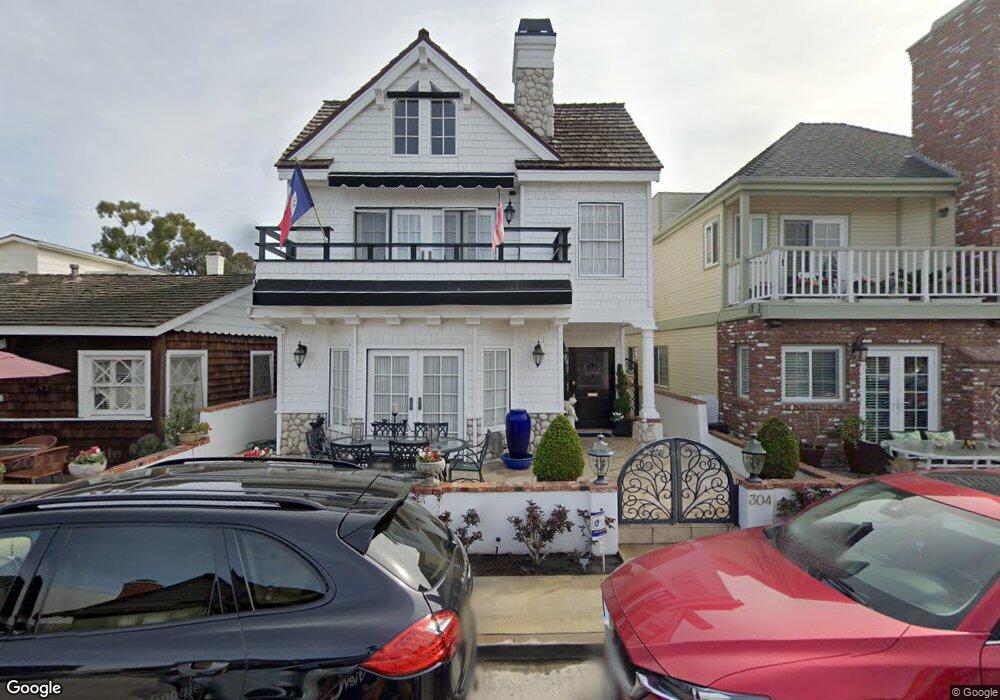
304 Onyx Ave Newport Beach, CA 92662
Balboa Island NeighborhoodEstimated Value: $3,465,256 - $6,069,000
4
Beds
3
Baths
2,270
Sq Ft
$2,114/Sq Ft
Est. Value
About This Home
This home is located at 304 Onyx Ave, Newport Beach, CA 92662 and is currently estimated at $4,798,314, approximately $2,113 per square foot. 304 Onyx Ave is a home with nearby schools including Abraham Lincoln Elementary School, Corona del Mar Middle and High School, and German School Campus.
Ownership History
Date
Name
Owned For
Owner Type
Purchase Details
Closed on
Apr 23, 2012
Sold by
The Roman Catholic Bishop Of Orange
Bought by
Saint John Vianney Chapel
Current Estimated Value
Purchase Details
Closed on
Apr 3, 2000
Sold by
Barbara Batson and Barbara Peggy Y
Bought by
The Roman Catholic Bishop Of Orange
Purchase Details
Closed on
Jul 24, 1998
Sold by
Mahfood Peggy Y
Bought by
Mahfood Peggy Y and Peggy Y Mahfood Living Trust
Purchase Details
Closed on
Oct 5, 1994
Sold by
Lippnik Eugene J and Lippnik Karen M
Bought by
Batson Barbara J and Mahfood Peggy Y
Home Financials for this Owner
Home Financials are based on the most recent Mortgage that was taken out on this home.
Original Mortgage
$500,100
Interest Rate
8.54%
Purchase Details
Closed on
Nov 19, 1993
Sold by
Davis Donald G and Davis Ann H
Bought by
Lippnik Eugene J and Lippnik Karen M
Create a Home Valuation Report for This Property
The Home Valuation Report is an in-depth analysis detailing your home's value as well as a comparison with similar homes in the area
Home Values in the Area
Average Home Value in this Area
Purchase History
| Date | Buyer | Sale Price | Title Company |
|---|---|---|---|
| Saint John Vianney Chapel | -- | Fidelity National Title | |
| The Roman Catholic Bishop Of Orange | $1,115,000 | First American Title Ins Co | |
| Mahfood Peggy Y | -- | -- | |
| Batson Barbara J | -- | -- | |
| Batson Barbara J | $795,000 | United Title Company | |
| Lippnik Eugene J | -- | California Counties Title Co |
Source: Public Records
Mortgage History
| Date | Status | Borrower | Loan Amount |
|---|---|---|---|
| Previous Owner | Batson Barbara J | $500,100 |
Source: Public Records
Tax History Compared to Growth
Tax History
| Year | Tax Paid | Tax Assessment Tax Assessment Total Assessment is a certain percentage of the fair market value that is determined by local assessors to be the total taxable value of land and additions on the property. | Land | Improvement |
|---|---|---|---|---|
| 2025 | $3,044 | $1,713,733 | $1,368,009 | $345,724 |
| 2024 | $3,044 | $1,680,131 | $1,341,185 | $338,946 |
| 2023 | $2,938 | $1,647,188 | $1,314,888 | $332,300 |
| 2022 | $369 | $1,614,891 | $1,289,106 | $325,785 |
| 2021 | $364 | $1,583,227 | $1,263,829 | $319,398 |
| 2020 | $360 | $1,566,993 | $1,250,870 | $316,123 |
| 2019 | $360 | $1,536,268 | $1,226,343 | $309,925 |
| 2018 | $356 | $1,506,146 | $1,202,297 | $303,849 |
| 2017 | $351 | $1,476,614 | $1,178,722 | $297,892 |
| 2016 | $347 | $1,447,661 | $1,155,610 | $292,051 |
| 2015 | $342 | $1,425,916 | $1,138,251 | $287,665 |
| 2014 | -- | $1,397,985 | $1,115,954 | $282,031 |
Source: Public Records
Map
Nearby Homes
- 305 Grand Canal
- 215 Marine Ave
- 1103 Balboa Ave
- 1201 N Bay Front
- 308 Coral Ave
- 214 Abalone Ave
- 115 Apolena Ave
- 126 Sapphire Ave
- 1203 Bayside Dr
- 316 Diamond Ave
- 1241 Bayside Dr Unit 209
- 804 Park Ave
- 990 Bayside Cove Unit 609
- 994 Bayside Cove Unit 611
- 201 Diamond Ave
- 1119 Dolphin Terrace
- 117 E Bay Front
- 126 Ruby Ave
- 112 Ruby Ave
- 1120 Dolphin Terrace
- 306 Onyx Ave
- 302 Onyx Ave
- 308 Onyx Ave
- 300 Onyx Ave
- 310 Onyx Ave Unit A
- 310 Onyx Ave Unit A & B
- 310 Onyx Ave
- 309 Marine Ave
- 312 Onyx Ave
- 311 Marine Ave
- 307 Onyx Ave
- 309 Onyx Ave
- 301 Onyx Ave
- 313 Marine Ave
- 314 Onyx Ave Unit 314 A
- 314 Onyx Ave Unit 314 B
- 314 Onyx Ave
- 311 Onyx Ave
- 224 Onyx Ave
- 313 Onyx Ave