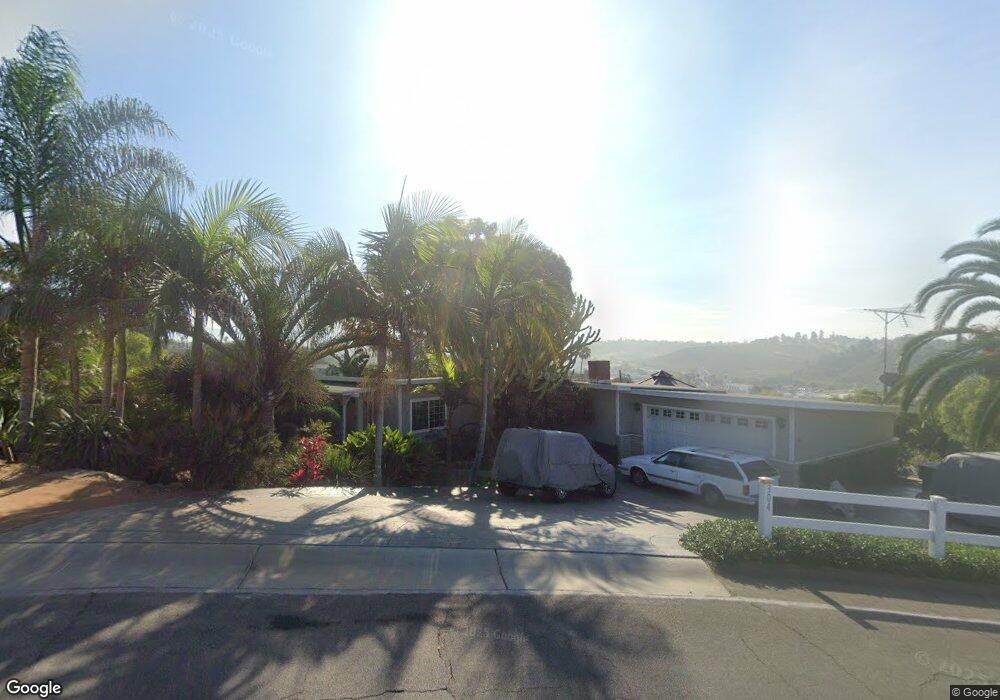
304 S Barnwell St Oceanside, CA 92054
Loma Alta NeighborhoodEstimated Value: $845,000 - $1,297,417
3
Beds
2
Baths
1,500
Sq Ft
$738/Sq Ft
Est. Value
About This Home
This home is located at 304 S Barnwell St, Oceanside, CA 92054 and is currently estimated at $1,107,354, approximately $738 per square foot. 304 S Barnwell St is a home located in San Diego County with nearby schools including Lincoln Middle School, Oceanside High School, and Oceanside Adventist Elementary School.
Ownership History
Date
Name
Owned For
Owner Type
Purchase Details
Closed on
Dec 18, 2000
Sold by
Dreyfus Jaime N and Dreyfus Constancia S
Bought by
Liggett James E and Liggett Joyce E
Current Estimated Value
Purchase Details
Closed on
Nov 5, 1997
Sold by
Baker Harold L
Bought by
Dreyfus Jaime N and Dreyfus Constancia S
Purchase Details
Closed on
Aug 26, 1997
Sold by
Hawthorne Svgs Fsb
Bought by
Baker Harold L
Home Financials for this Owner
Home Financials are based on the most recent Mortgage that was taken out on this home.
Original Mortgage
$85,000
Interest Rate
7.45%
Purchase Details
Closed on
May 5, 1997
Sold by
Jenco Inc
Bought by
Hawthorne Svgs Fsb
Purchase Details
Closed on
Feb 13, 1996
Sold by
Miller Moira Scott
Bought by
Miller Leonard A
Purchase Details
Closed on
Mar 3, 1993
Purchase Details
Closed on
Jan 17, 1990
Create a Home Valuation Report for This Property
The Home Valuation Report is an in-depth analysis detailing your home's value as well as a comparison with similar homes in the area
Home Values in the Area
Average Home Value in this Area
Purchase History
| Date | Buyer | Sale Price | Title Company |
|---|---|---|---|
| Liggett James E | $250,000 | California Title Company | |
| Dreyfus Jaime N | $122,500 | Chicago Title Co | |
| Baker Harold L | $85,000 | Chicago Title | |
| Hawthorne Svgs Fsb | $135,000 | American Title Co | |
| Miller Leonard A | -- | -- | |
| -- | $274,000 | -- | |
| -- | $340,000 | -- |
Source: Public Records
Mortgage History
| Date | Status | Borrower | Loan Amount |
|---|---|---|---|
| Previous Owner | Baker Harold L | $85,000 |
Source: Public Records
Tax History Compared to Growth
Tax History
| Year | Tax Paid | Tax Assessment Tax Assessment Total Assessment is a certain percentage of the fair market value that is determined by local assessors to be the total taxable value of land and additions on the property. | Land | Improvement |
|---|---|---|---|---|
| 2025 | $4,152 | $376,683 | $339,029 | $37,654 |
| 2024 | $4,152 | $369,298 | $332,382 | $36,916 |
| 2023 | $4,024 | $362,058 | $325,865 | $36,193 |
| 2022 | $3,963 | $354,960 | $319,476 | $35,484 |
| 2021 | $3,977 | $348,001 | $313,212 | $34,789 |
| 2020 | $3,855 | $344,434 | $310,001 | $34,433 |
| 2019 | $3,744 | $337,681 | $303,923 | $33,758 |
| 2018 | $3,703 | $331,061 | $297,964 | $33,097 |
| 2017 | $3,635 | $324,571 | $292,122 | $32,449 |
| 2016 | $3,517 | $318,208 | $286,395 | $31,813 |
| 2015 | $3,415 | $313,430 | $282,094 | $31,336 |
| 2014 | $3,285 | $307,292 | $276,569 | $30,723 |
Source: Public Records
Map
Nearby Homes
- 116 N Barnwell St
- 139 Parnassus Cir
- 2743 Mesa Dr
- 2710 Mesa Dr
- 2813 Cottingham St
- 216 Pajama Dr
- 2250 Oceanside Blvd
- 432 Edgehill Ln Unit 160
- 432 Edgehill Ln Unit 26
- 432 Edgehill Ln Unit 41
- 223 Cottingham Ct
- 2867 Turnbull St
- 2921 Cottingham St
- 2959 Butler St
- 0 Crouch St
- 506 Canyon Dr Unit 85
- 506 Canyon Dr Unit 61
- 552 Canyon Dr Unit 29
- 1303 Crestridge Dr
- 2428 Dunstan St
- 337 S Barnwell St
- 236 S Barnwell St
- 347 S Barnwell St
- 310 S Barnwell St
- 339 S Barnwell St
- 307 S Barnwell St
- 232 S Barnwell St
- 334 Squire Place
- 2605 Guinevere Dr
- 2609 Guinevere Dr
- 2603 Guinevere Dr
- 2613 Guinevere Dr
- 2613 Guinevere St
- 2617 Guinevere Dr
- 228 S Barnwell St
- 2614 Lancelot Dr
- 404 S Barnwell St
- 2613 Lancelot Dr
- 401 S Barnwell St
- 220 S Barnwell St