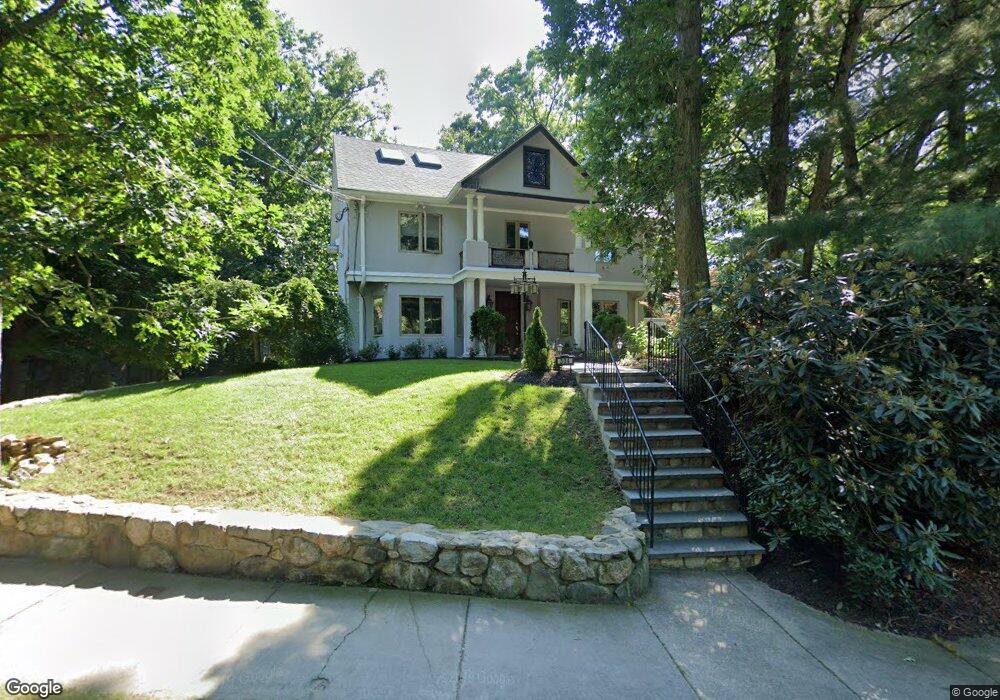
304 Waban Ave Waban, MA 02468
Waban NeighborhoodEstimated Value: $1,830,000 - $2,325,000
4
Beds
4
Baths
2,929
Sq Ft
$711/Sq Ft
Est. Value
About This Home
This home is located at 304 Waban Ave, Waban, MA 02468 and is currently estimated at $2,081,417, approximately $710 per square foot. 304 Waban Ave is a home located in Middlesex County with nearby schools including Angier Elementary School, Charles E Brown Middle School, and Newton South High School.
Ownership History
Date
Name
Owned For
Owner Type
Purchase Details
Closed on
Sep 13, 2017
Sold by
Mikkelson Benny P
Bought by
Mikkelson Benny P and Shi Qing
Current Estimated Value
Purchase Details
Closed on
Mar 3, 2011
Sold by
To Tri V
Bought by
Mikkelsen Benny P and Shi Qing
Home Financials for this Owner
Home Financials are based on the most recent Mortgage that was taken out on this home.
Original Mortgage
$683,200
Interest Rate
4.76%
Mortgage Type
Purchase Money Mortgage
Purchase Details
Closed on
Jun 29, 2005
Sold by
Blacker Fay Sondra and Ginsberg Fay Sondra
Bought by
Tri To Van and To Tri Van
Home Financials for this Owner
Home Financials are based on the most recent Mortgage that was taken out on this home.
Original Mortgage
$1,040,000
Interest Rate
5.73%
Mortgage Type
Purchase Money Mortgage
Create a Home Valuation Report for This Property
The Home Valuation Report is an in-depth analysis detailing your home's value as well as a comparison with similar homes in the area
Home Values in the Area
Average Home Value in this Area
Purchase History
| Date | Buyer | Sale Price | Title Company |
|---|---|---|---|
| Mikkelson Benny P | -- | -- | |
| Mikkelson Benny P | -- | -- | |
| Mikkelsen Benny P | $854,000 | -- | |
| Tri To Van | $1,095,000 | -- |
Source: Public Records
Mortgage History
| Date | Status | Borrower | Loan Amount |
|---|---|---|---|
| Previous Owner | Mikkelsen Benny P | $683,200 | |
| Previous Owner | Tri To Van | $1,040,000 |
Source: Public Records
Tax History Compared to Growth
Tax History
| Year | Tax Paid | Tax Assessment Tax Assessment Total Assessment is a certain percentage of the fair market value that is determined by local assessors to be the total taxable value of land and additions on the property. | Land | Improvement |
|---|---|---|---|---|
| 2025 | $17,386 | $1,774,100 | $1,431,800 | $342,300 |
| 2024 | $16,811 | $1,722,400 | $1,390,100 | $332,300 |
| 2023 | $15,512 | $1,523,800 | $1,059,400 | $464,400 |
| 2022 | $14,843 | $1,410,900 | $980,900 | $430,000 |
| 2021 | $14,322 | $1,331,000 | $925,400 | $405,600 |
| 2020 | $13,896 | $1,331,000 | $925,400 | $405,600 |
| 2019 | $13,503 | $1,292,200 | $898,400 | $393,800 |
| 2018 | $13,132 | $1,213,700 | $806,200 | $407,500 |
| 2017 | $12,732 | $1,145,000 | $760,600 | $384,400 |
| 2016 | $12,178 | $1,070,100 | $710,800 | $359,300 |
| 2015 | $11,611 | $1,000,100 | $664,300 | $335,800 |
Source: Public Records
Map
Nearby Homes
- 177 Varick Rd
- 34 Palmer Rd
- 45 E Quinobequin Rd
- 10 Lorraine Cir
- 33 Metacomet Rd
- 1801 Beacon St
- 2084 Washington St
- 34 Pilgrim Rd
- 45 Moulton St
- 18 Annawan Rd
- 6 Willow St
- 20 Kinmonth Rd Unit 203
- 20 Kinmonth Rd Unit 306
- 115 Windsor Rd
- 29 Montclair Rd
- 17 Deforest Rd
- 206 Cedar St
- 181 Saint Mary St
- 10 Fife Rd
- 7 Crescent St