3040 Main St Morro Bay, CA 93442
Estimated Value: $608,729 - $667,000
About This Home
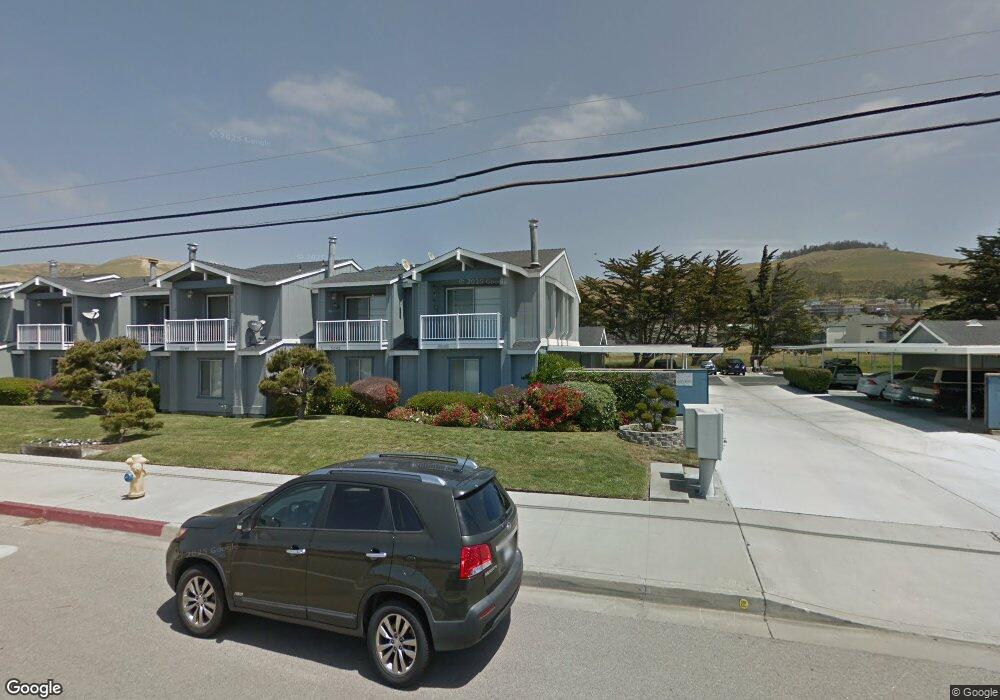
This home is located at 3040 Main St, Morro Bay, CA 93442 and is currently estimated at $643,932, approximately $533 per square foot. 3040 Main St is a home located in San Luis Obispo County with nearby schools including Del Mar Elementary School, Los Osos Middle School, and Morro Bay High School.
Ownership History
We collect this data history from publicly available records. To have your information removed, we recommend requesting removal directly through your county’s website.
Purchase Details
Purchase Details
Home Financials for this Owner
Home Financials are based on the most recent Mortgage that was taken out on this home.Home Values in the Area
Average Home Value in this Area
Purchase History
We collect this data history from publicly available records. To have your information removed, we recommend requesting removal directly through your county’s website.
| Date | Buyer | Sale Price | Title Company |
|---|---|---|---|
| -- | None Available | ||
| -- | Chicago Title Company |
Mortgage History
We collect this data history from publicly available records. To have your information removed, we recommend requesting removal directly through your county’s website.
| Date | Status | Borrower | Loan Amount |
|---|---|---|---|
| Closed | $79,000 |
Tax History
We collect this data history from publicly available records. To have your information removed, we recommend requesting removal directly through your county’s website.
| Year | Tax Paid | Tax Assessment Tax Assessment Total Assessment is a certain percentage of the fair market value that is determined by local assessors to be the total taxable value of land and additions on the property. | Land | Improvement |
|---|---|---|---|---|
| 2025 | $2,817 | $260,010 | $121,339 | $138,671 |
| 2024 | $2,766 | $254,912 | $118,960 | $135,952 |
| 2023 | $2,766 | $249,915 | $116,628 | $133,287 |
| 2022 | $2,593 | $245,016 | $114,342 | $130,674 |
| 2021 | $2,552 | $240,212 | $112,100 | $128,112 |
| 2020 | $2,525 | $237,750 | $110,951 | $126,799 |
| 2019 | $2,499 | $233,089 | $108,776 | $124,313 |
| 2018 | $2,450 | $228,520 | $106,644 | $121,876 |
| 2017 | $2,402 | $224,040 | $104,553 | $119,487 |
| 2016 | $2,355 | $219,648 | $102,503 | $117,145 |
| 2015 | $2,319 | $216,350 | $100,964 | $115,386 |
| 2014 | $2,130 | $212,113 | $98,987 | $113,126 |
Map
- 329 Sequoia St Unit 8
- 325 Sequoia St Unit 7
- 333 Sequoia St Unit 9
- 337 Sequoia St
- 3034 Main St
- 3036 Main St Unit 19
- 3038 Main St
- 3032 Main St Unit 17
- 3032 Main St
- 317 Sequoia St Unit 5
- 321 Sequoia St Unit 6
- 313 Sequoia St Unit 4
- 313 Sequoia St
- 3020 Main St
- 309 Sequoia St
- 3022 Main St
- 3024 Main St Unit 14
- 3024 Main St Unit 120
- 305 Sequoia St
- 301 Sequoia St
Ask me questions while you tour the home.