3040 W Lark Ave Visalia, CA 93291
Northwest Visalia NeighborhoodEstimated Value: $543,086 - $610,000
6
Beds
3
Baths
2,805
Sq Ft
$204/Sq Ft
Est. Value
About This Home
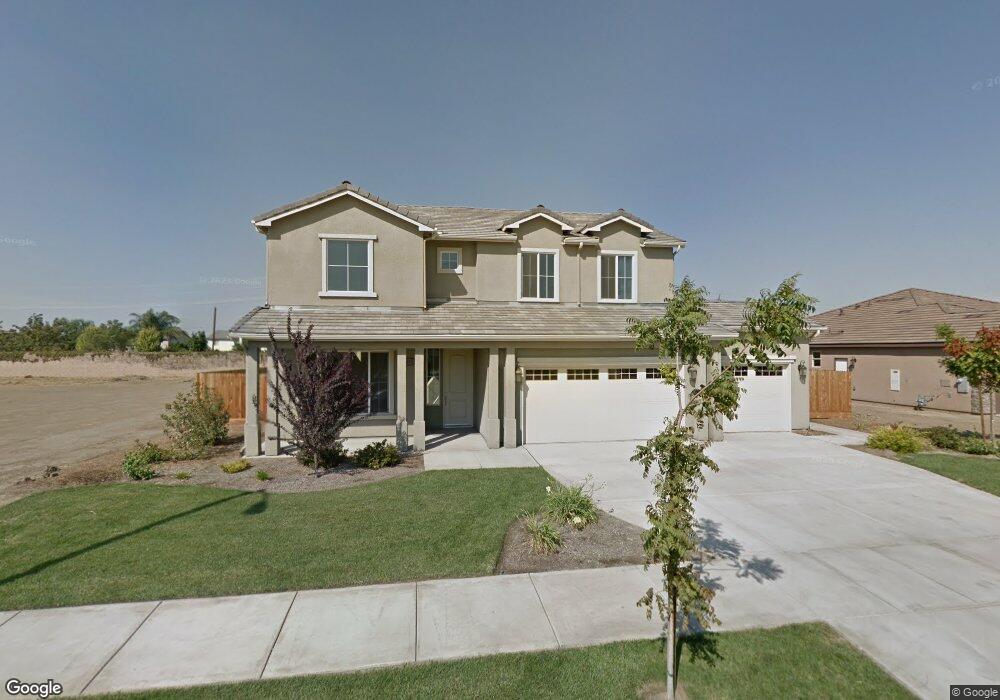
This home is located at 3040 W Lark Ave, Visalia, CA 93291 and is currently estimated at $573,272, approximately $204 per square foot. 3040 W Lark Ave is a home located in Tulare County with nearby schools including Manuel F. Hernandez, Green Acres Middle School, and Redwood High School.
Ownership History
Date
Name
Owned For
Owner Type
Purchase Details
Closed on
Jun 27, 2014
Sold by
Stonegate Development Group Inc
Bought by
Reed Kyle and Reed Jenna
Current Estimated Value
Home Financials for this Owner
Home Financials are based on the most recent Mortgage that was taken out on this home.
Original Mortgage
$77,000
Interest Rate
3.75%
Mortgage Type
Seller Take Back
Purchase Details
Closed on
Oct 17, 2012
Sold by
Vander Weerd General Construction
Bought by
Stonegate Development Group Inc
Purchase Details
Closed on
Feb 27, 2012
Sold by
Quality Property Asset Management Compan
Bought by
Vander Weerd General Construction Inc
Purchase Details
Closed on
Jul 8, 2011
Sold by
Ennis Homes Inc
Bought by
Quality Properties Asset Management Comp
Create a Home Valuation Report for This Property
The Home Valuation Report is an in-depth analysis detailing your home's value as well as a comparison with similar homes in the area
Home Values in the Area
Average Home Value in this Area
Purchase History
| Date | Buyer | Sale Price | Title Company |
|---|---|---|---|
| Reed Kyle | $127,000 | Chicago Title Company | |
| Stonegate Development Group Inc | $160,000 | Chicago Title Company | |
| Vander Weerd General Construction Inc | -- | Chicago Title Co | |
| Quality Properties Asset Management Comp | $359,100 | None Available |
Source: Public Records
Mortgage History
| Date | Status | Borrower | Loan Amount |
|---|---|---|---|
| Previous Owner | Reed Kyle | $77,000 |
Source: Public Records
Tax History Compared to Growth
Tax History
| Year | Tax Paid | Tax Assessment Tax Assessment Total Assessment is a certain percentage of the fair market value that is determined by local assessors to be the total taxable value of land and additions on the property. | Land | Improvement |
|---|---|---|---|---|
| 2025 | $4,183 | $374,796 | $66,102 | $308,694 |
| 2024 | $4,183 | $367,448 | $64,806 | $302,642 |
| 2023 | $4,074 | $360,244 | $63,536 | $296,708 |
| 2022 | $3,956 | $353,182 | $62,291 | $290,891 |
| 2021 | $3,908 | $346,257 | $61,070 | $285,187 |
| 2020 | $3,886 | $342,707 | $60,444 | $282,263 |
| 2019 | $3,772 | $335,987 | $59,259 | $276,728 |
| 2018 | $3,692 | $329,399 | $58,097 | $271,302 |
| 2017 | $1,522 | $120,957 | $36,074 | $84,883 |
| 2016 | $1,494 | $118,586 | $35,367 | $83,219 |
| 2015 | $1,458 | $116,805 | $34,836 | $81,969 |
| 2014 | $1,458 | $114,517 | $34,154 | $80,363 |
Source: Public Records
Map
Nearby Homes
- 3103 W Wren Ave
- 2851 W Sedona Ave
- 3137 W Delaware Ct
- 2805 W Brooke Ave
- 2667 W Payson Ave
- 2336 N University St
- 3542 W Oakridge Ave
- 5035 W Sunnyview Ct Unit Syc57
- 3624 N Jackie St
- 3010 W Ceres Ave
- 3615 W Sunnyview Ave
- 7930 W Sunnyview Ave
- 3733 N Mendonca St
- 2326 W Flagstaff Ct
- 2650 N Kayenta St
- 2108 N Woodland St
- 3024 W Lark Ave
- 3100 W Lark Ave Unit 2
- 3120 W Lark Ave
- 3008 W Lark Ave
- 3101 W Lark Ave
- 3037 W Lark Ave
- 3023 W Lark Ave
- 2930 W Lark Ave
- 3007 W Lark Ave
- 2931 W Lark Ave
- 3121 W Lark Ave
- 3204 W Lark Ave
- 3205 W Lark Ave
- 2916 W Lark Ave
- 3022 W Oriole Ave
- 3104 W Oriole Ave
- 3038 W Oriole Ave
- 2915 W Lark Ave
- 3006 W Oriole Ave
- 3228 W Lark Ave