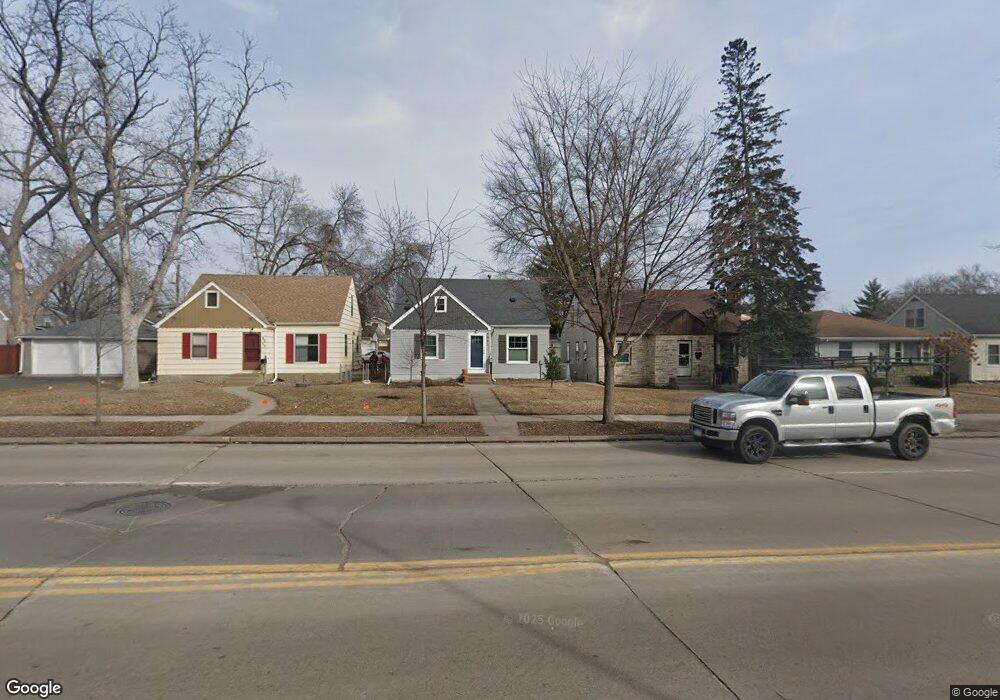
3041 Louisiana Ave S St. Louis Park, MN 55426
Lenox NeighborhoodEstimated Value: $354,407 - $378,000
3
Beds
2
Baths
1,215
Sq Ft
$302/Sq Ft
Est. Value
About This Home
This home is located at 3041 Louisiana Ave S, St. Louis Park, MN 55426 and is currently estimated at $367,352, approximately $302 per square foot. 3041 Louisiana Ave S is a home located in Hennepin County with nearby schools including Peter Hobart Elementary School, St. Louis Park Middle School, and St. Louis Park High School.
Ownership History
Date
Name
Owned For
Owner Type
Purchase Details
Closed on
Oct 7, 2020
Sold by
Kipp Amanda and Kipp Robert Edward
Bought by
Kipp Amanda and Kipp Robert Edward
Current Estimated Value
Home Financials for this Owner
Home Financials are based on the most recent Mortgage that was taken out on this home.
Original Mortgage
$141,500
Outstanding Balance
$101,261
Interest Rate
2.7%
Mortgage Type
New Conventional
Estimated Equity
$266,091
Purchase Details
Closed on
Jul 17, 2015
Sold by
Kirzeder Thomas C
Bought by
Olson Amanda C
Home Financials for this Owner
Home Financials are based on the most recent Mortgage that was taken out on this home.
Original Mortgage
$171,200
Interest Rate
4.05%
Mortgage Type
New Conventional
Purchase Details
Closed on
Mar 23, 2010
Sold by
Federal National Mortgage Association
Bought by
Krizeder Thomas C and Swartout Marit R
Purchase Details
Closed on
Apr 16, 1998
Sold by
Bhandari Yoginder M
Bought by
Vos Barbara L
Create a Home Valuation Report for This Property
The Home Valuation Report is an in-depth analysis detailing your home's value as well as a comparison with similar homes in the area
Home Values in the Area
Average Home Value in this Area
Purchase History
| Date | Buyer | Sale Price | Title Company |
|---|---|---|---|
| Kipp Amanda | -- | Burnet Title | |
| Olson Amanda C | $214,000 | Burnet Title | |
| Krizeder Thomas C | $166,000 | -- | |
| Vos Barbara L | $99,500 | -- |
Source: Public Records
Mortgage History
| Date | Status | Borrower | Loan Amount |
|---|---|---|---|
| Open | Kipp Amanda | $141,500 | |
| Closed | Olson Amanda C | $171,200 |
Source: Public Records
Tax History Compared to Growth
Tax History
| Year | Tax Paid | Tax Assessment Tax Assessment Total Assessment is a certain percentage of the fair market value that is determined by local assessors to be the total taxable value of land and additions on the property. | Land | Improvement |
|---|---|---|---|---|
| 2024 | $4,288 | $321,400 | $116,600 | $204,800 |
| 2023 | $4,278 | $327,800 | $116,600 | $211,200 |
| 2022 | $3,847 | $327,300 | $116,100 | $211,200 |
| 2021 | $3,442 | $296,600 | $101,000 | $195,600 |
| 2020 | $3,498 | $270,900 | $96,200 | $174,700 |
| 2019 | $3,318 | $264,800 | $91,700 | $173,100 |
| 2018 | $3,201 | $244,800 | $87,400 | $157,400 |
| 2017 | $2,816 | $211,500 | $69,200 | $142,300 |
| 2016 | $2,339 | $175,200 | $62,500 | $112,700 |
| 2015 | $2,229 | $163,900 | $58,500 | $105,400 |
| 2014 | -- | $151,000 | $55,600 | $95,400 |
Source: Public Records
Map
Nearby Homes
- 7217 Minnetonka Blvd
- 3124 Maryland Ave S
- 3101 Nevada Ave S
- 3149 Nevada Ave S
- 3153 Nevada Ave S
- 3216 Kentucky Ave S
- 2849 Jersey Ave S
- 3131 Georgia Ave S
- 2852 Hampshire Ave S
- 3267 Library Ln
- 3056 Florida Ave S
- 2925 Georgia Ave S
- 3320 Louisiana Ave S Unit 311
- 3320 Louisiana Ave S Unit 410
- 3320 Louisiana Ave S Unit 310
- 3320 Louisiana Ave S Unit 112
- 3300 Louisiana Ave S Unit 517
- 3320 Louisiana Ave S Unit 106
- 3300 Louisiana Ave S Unit 422
- 3251 Louisiana Ave S Unit 304
- 3041 Louisiana Ave S
- 3037 Louisiana Ave S
- 3045 Louisiana Ave S
- 3049 Louisiana Ave S
- 3037 3037 Louisiana Ave S
- 3037 3037 Louisiana-Avenue-s
- 3029 Louisiana Ave S
- 3053 Louisiana Ave S
- 3040 Kentucky Ave S
- 3025 Louisiana Ave S
- 3036 Kentucky Ave S
- 3044 Kentucky Ave S
- 3044 Louisiana Ave S
- 3032 Kentucky Ave S
- 3048 Kentucky Ave S
- 3025 3025 Louisiana Ave S
- 3040 Louisiana Ave S
- 3036 Louisiana Ave S
- 3044 Louisiana Ave S
- 3057 3057 Louisiana-Avenue-s