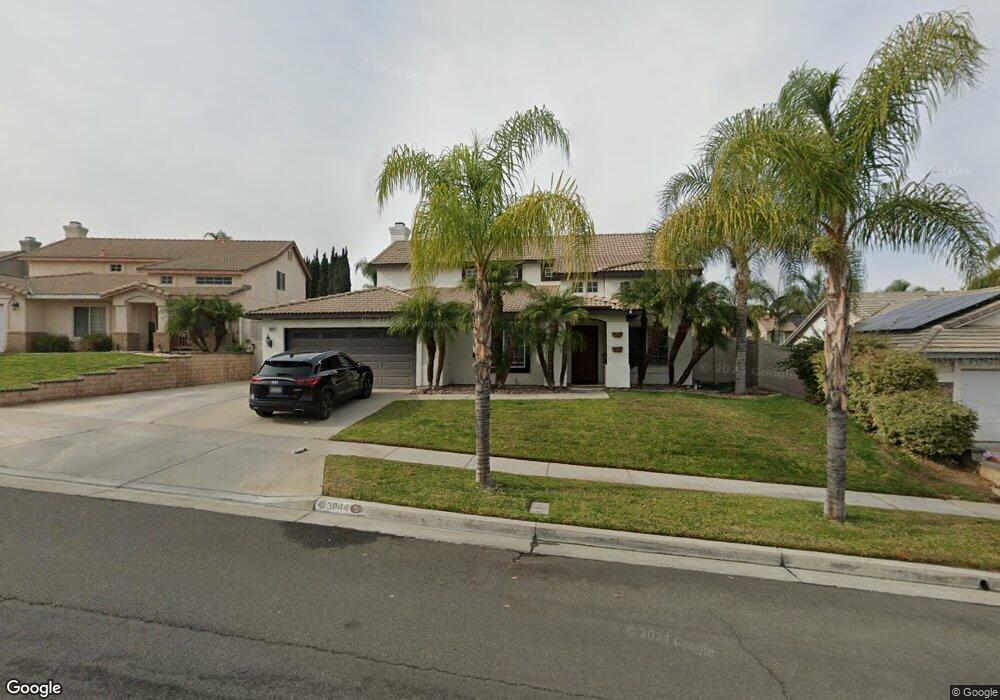
3044 Pansy Cir Corona, CA 92881
South Corona NeighborhoodEstimated Value: $858,000 - $944,000
4
Beds
3
Baths
2,190
Sq Ft
$406/Sq Ft
Est. Value
About This Home
This home is located at 3044 Pansy Cir, Corona, CA 92881 and is currently estimated at $889,136, approximately $405 per square foot. 3044 Pansy Cir is a home located in Riverside County with nearby schools including Susan B. Anthony Elementary School, Citrus Hills Intermediate School, and Santiago High School.
Ownership History
Date
Name
Owned For
Owner Type
Purchase Details
Closed on
May 2, 2023
Sold by
Almeida Dominique and Almeida Dominique
Bought by
Almeida Family Trust
Current Estimated Value
Purchase Details
Closed on
Jul 23, 2002
Sold by
Lee Lisa and Lee Lisa A
Bought by
Almeida Mark and Almeida Dominique
Home Financials for this Owner
Home Financials are based on the most recent Mortgage that was taken out on this home.
Original Mortgage
$254,400
Interest Rate
6.16%
Mortgage Type
Purchase Money Mortgage
Purchase Details
Closed on
Jun 27, 2002
Sold by
Lee Dwayne A
Bought by
Lee Lisa A
Home Financials for this Owner
Home Financials are based on the most recent Mortgage that was taken out on this home.
Original Mortgage
$254,400
Interest Rate
6.16%
Mortgage Type
Purchase Money Mortgage
Purchase Details
Closed on
Jun 5, 1997
Sold by
Fieldstone Communities Inc
Bought by
Lee Ii Dwayne A and Lee Lisa A
Home Financials for this Owner
Home Financials are based on the most recent Mortgage that was taken out on this home.
Original Mortgage
$154,730
Interest Rate
7.57%
Mortgage Type
FHA
Create a Home Valuation Report for This Property
The Home Valuation Report is an in-depth analysis detailing your home's value as well as a comparison with similar homes in the area
Home Values in the Area
Average Home Value in this Area
Purchase History
| Date | Buyer | Sale Price | Title Company |
|---|---|---|---|
| Almeida Family Trust | -- | None Listed On Document | |
| Almeida Mark | $318,000 | Southland Title | |
| Lee Lisa A | -- | -- | |
| Lee Ii Dwayne A | $158,500 | First American Title Ins Co |
Source: Public Records
Mortgage History
| Date | Status | Borrower | Loan Amount |
|---|---|---|---|
| Previous Owner | Almeida Mark | $254,400 | |
| Previous Owner | Lee Ii Dwayne A | $154,730 |
Source: Public Records
Tax History Compared to Growth
Tax History
| Year | Tax Paid | Tax Assessment Tax Assessment Total Assessment is a certain percentage of the fair market value that is determined by local assessors to be the total taxable value of land and additions on the property. | Land | Improvement |
|---|---|---|---|---|
| 2025 | $5,761 | $511,283 | $108,608 | $402,675 |
| 2023 | $5,761 | $491,432 | $104,392 | $387,040 |
| 2022 | $5,584 | $481,797 | $102,346 | $379,451 |
| 2021 | $5,476 | $472,351 | $100,340 | $372,011 |
| 2020 | $5,418 | $467,509 | $99,312 | $368,197 |
| 2019 | $4,844 | $417,755 | $97,365 | $320,390 |
| 2018 | $5,383 | $409,564 | $95,457 | $314,107 |
| 2017 | $5,465 | $401,535 | $93,586 | $307,949 |
| 2016 | $5,457 | $393,662 | $91,751 | $301,911 |
| 2015 | $5,373 | $387,751 | $90,374 | $297,377 |
| 2014 | $5,241 | $380,156 | $88,604 | $291,552 |
Source: Public Records
Map
Nearby Homes
- 3160 Vermont Dr
- 1236 Kendrick Ct
- 1236 Emeraldport St
- 1078 Sunbeam Ln
- 1088 Viewpointe Ln
- 1324 Soundview Cir
- 1338 Coral Gables Cir
- 974 Alexandra Dr
- 651 Viewpointe Ln
- 2560 Kingston Dr
- 3024 Sonrisa Dr
- 2680 Flora Spiegel Way
- 1555 Lupine Cir
- 1414 Baldwin Dr
- 1561 E Chase Dr
- 3805 Fremont Dr
- 3308 Willow Park Cir
- 970 Riverview Cir
- 3100 Garretson Ave
- 1180 Cleveland Way
- 3032 Pansy Cir
- 3056 Pansy Cir
- 3051 Petunia Way
- 3065 Petunia Way
- 3037 Petunia Way
- 3020 Pansy Cir
- 3068 Pansy Cir
- 3079 Petunia Way
- 3047 Pansy Cir
- 3035 Pansy Cir
- 3023 Petunia Way
- 3059 Pansy Cir
- 3023 Pansy Cir
- 3008 Pansy Cir
- 3093 Petunia Way
- 3009 Petunia Way
- 3011 Pansy Cir
- 3071 Pansy Cir
- 1142 Pampas Cir
- 3046 Geranium Way