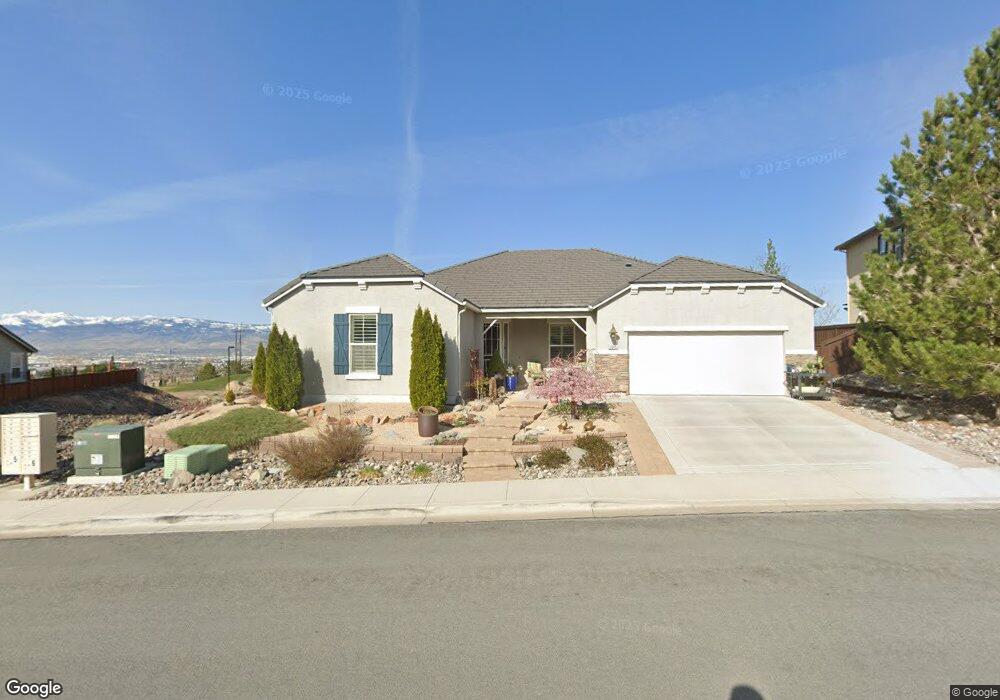
3045 Brachetto Loop Sparks, NV 89434
D'Andrea NeighborhoodEstimated Value: $724,837 - $790,000
3
Beds
3
Baths
2,617
Sq Ft
$290/Sq Ft
Est. Value
About This Home
This home is located at 3045 Brachetto Loop, Sparks, NV 89434 and is currently estimated at $759,709, approximately $290 per square foot. 3045 Brachetto Loop is a home with nearby schools including Marvin Moss Elementary School, Lou Mendive Middle School, and Edward C Reed High School.
Ownership History
Date
Name
Owned For
Owner Type
Purchase Details
Closed on
Oct 11, 2024
Sold by
Inouye Daniel K and Inouye Yong C
Bought by
Inouye Family Trust and Inouye
Current Estimated Value
Purchase Details
Closed on
Nov 13, 2013
Sold by
Inouye Daniel K and Inouye Yong C
Bought by
Inouye Daniel K and Inouye Yong C
Home Financials for this Owner
Home Financials are based on the most recent Mortgage that was taken out on this home.
Original Mortgage
$286,000
Interest Rate
4.18%
Mortgage Type
New Conventional
Purchase Details
Closed on
Jan 30, 2012
Sold by
Lennar Reno Llc
Bought by
Inouye Daniel K and Abolinas Yong C
Home Financials for this Owner
Home Financials are based on the most recent Mortgage that was taken out on this home.
Original Mortgage
$306,279
Interest Rate
3.87%
Mortgage Type
FHA
Purchase Details
Closed on
May 27, 2011
Sold by
Lw Dandrea Llc
Bought by
Lennar Reno Llc
Create a Home Valuation Report for This Property
The Home Valuation Report is an in-depth analysis detailing your home's value as well as a comparison with similar homes in the area
Home Values in the Area
Average Home Value in this Area
Purchase History
| Date | Buyer | Sale Price | Title Company |
|---|---|---|---|
| Inouye Family Trust | -- | None Listed On Document | |
| Inouye Daniel K | -- | Servicelink | |
| Inouye Daniel K | $314,500 | North American Title Reno | |
| Lennar Reno Llc | -- | Ticor Title Reno |
Source: Public Records
Mortgage History
| Date | Status | Borrower | Loan Amount |
|---|---|---|---|
| Previous Owner | Inouye Daniel K | $286,000 | |
| Previous Owner | Inouye Daniel K | $306,279 |
Source: Public Records
Tax History
| Year | Tax Paid | Tax Assessment Tax Assessment Total Assessment is a certain percentage of the fair market value that is determined by local assessors to be the total taxable value of land and additions on the property. | Land | Improvement |
|---|---|---|---|---|
| 2026 | $4,357 | $211,744 | $59,535 | $152,209 |
| 2024 | $5,642 | $209,614 | $55,283 | $154,332 |
| 2023 | $5,479 | $205,027 | $59,798 | $145,229 |
| 2022 | $5,319 | $170,099 | $49,392 | $120,707 |
| 2021 | $5,165 | $168,912 | $49,385 | $119,527 |
| 2020 | $5,012 | $167,498 | $48,195 | $119,303 |
| 2019 | $4,744 | $156,515 | $43,971 | $112,544 |
| 2018 | $4,606 | $142,540 | $33,975 | $108,565 |
| 2017 | $4,466 | $139,675 | $31,416 | $108,259 |
| 2016 | $4,353 | $140,775 | $30,524 | $110,251 |
| 2015 | $3,260 | $133,061 | $28,798 | $104,263 |
| 2014 | $4,218 | $118,739 | $28,679 | $90,060 |
| 2013 | -- | $116,209 | $27,727 | $88,482 |
Source: Public Records
Map
Nearby Homes
- 3375 Culpepper Dr
- 2485 Firenze Dr
- 2600 Anqua Ct
- 3307 Vincinato Dr
- 2854 Cintoia Dr
- 2199 Lucca Ln
- 1750 Corleone Dr
- 2419 Tecumseh Way
- 2389 Tecumseh Way Unit 15
- 2381 Tecumseh Way Unit 18
- 2408 Tecumseh Way
- 2730 Aristedes Dr
- 4060 Culpepper Dr
- 1759 Veneto Dr
- 4154 Pillary Ct
- 0 Martini Rd Unit 260001673
- 1741 Medolla Dr
- 4292 Desert Highlands Dr Unit 1
- 4301 Pinnacle Vista Ct Unit 1
- 3142 Jarbidge Way
- 3051 Brachetto Loop
- 3037 Brachetto Loop
- 3057 Brachetto Loop
- 3050 Brachetto Loop
- 3042 Brachetto Loop
- 3031 Brachetto Loop
- 3060 Brachetto Loop
- 3028 Brachetto Loop
- 3063 Brachetto Loop
- 3025 Brachetto Loop
- 2916 Lessini Ct
- 3072 Brachetto Loop
- 3069 Brachetto Loop
- 2924 Lessini Ct
- 3010 Brachetto Loop
- 3075 Brachetto Loop
- 3078 Brachetto Loop
- 3013 Brachetto Loop
- 2919 Lessini Ct
- 3081 Brachetto Loop
Your Personal Tour Guide
Ask me questions while you tour the home.