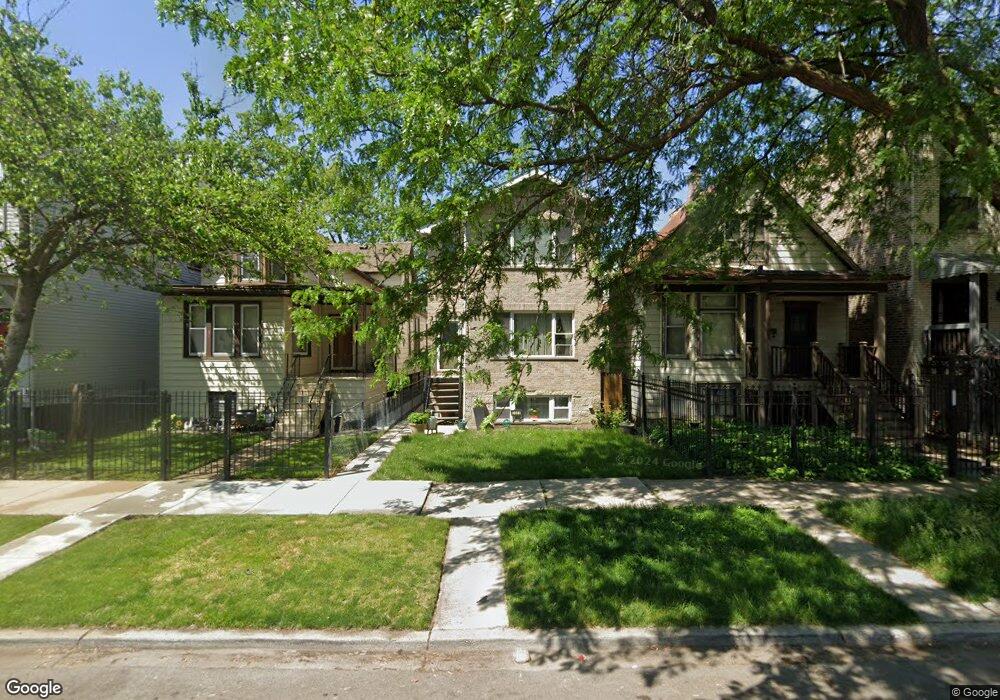
3046 N Christiana Ave Chicago, IL 60618
Avondale NeighborhoodEstimated Value: $886,000 - $963,000
4
Beds
2
Baths
2,055
Sq Ft
$450/Sq Ft
Est. Value
About This Home
This home is located at 3046 N Christiana Ave, Chicago, IL 60618 and is currently estimated at $925,335, approximately $450 per square foot. 3046 N Christiana Ave is a home located in Cook County with nearby schools including Avondale-Logandale Elementary School, Schurz High School, and Aspira Business & Finance High School.
Ownership History
Date
Name
Owned For
Owner Type
Purchase Details
Closed on
Dec 21, 2015
Sold by
Espinoza Silvester and Espinoza Martha
Bought by
Espinoza Silvester and Espinoza Maria
Current Estimated Value
Purchase Details
Closed on
Jan 13, 2004
Sold by
Espinoza Silvester
Bought by
Espinoza Silvester and Espinoza Martha
Home Financials for this Owner
Home Financials are based on the most recent Mortgage that was taken out on this home.
Original Mortgage
$180,000
Outstanding Balance
$84,179
Interest Rate
5.9%
Mortgage Type
Purchase Money Mortgage
Estimated Equity
$841,156
Purchase Details
Closed on
Mar 18, 1997
Sold by
Nodarse Lazaro and Nodarse Carolina
Bought by
Nodarse Investments Inc
Purchase Details
Closed on
Feb 13, 1996
Sold by
Lopez Tomas
Bought by
Nodarse Lazaro and Nodarse Carolina
Create a Home Valuation Report for This Property
The Home Valuation Report is an in-depth analysis detailing your home's value as well as a comparison with similar homes in the area
Home Values in the Area
Average Home Value in this Area
Purchase History
| Date | Buyer | Sale Price | Title Company |
|---|---|---|---|
| Espinoza Silvester | -- | Chicago Title Insurance Co | |
| Espinoza Silvester | -- | Netco | |
| Nodarse Investments Inc | -- | -- | |
| Nodarse Lazaro | $30,000 | -- |
Source: Public Records
Mortgage History
| Date | Status | Borrower | Loan Amount |
|---|---|---|---|
| Open | Espinoza Silvester | $180,000 |
Source: Public Records
Tax History Compared to Growth
Tax History
| Year | Tax Paid | Tax Assessment Tax Assessment Total Assessment is a certain percentage of the fair market value that is determined by local assessors to be the total taxable value of land and additions on the property. | Land | Improvement |
|---|---|---|---|---|
| 2024 | $12,003 | $73,000 | $13,376 | $59,624 |
| 2023 | $11,678 | $60,001 | $10,763 | $49,238 |
| 2022 | $11,678 | $60,001 | $10,763 | $49,238 |
| 2021 | $11,434 | $60,002 | $10,765 | $49,237 |
| 2020 | $9,120 | $43,893 | $4,920 | $38,973 |
| 2019 | $9,253 | $49,319 | $4,920 | $44,399 |
| 2018 | $9,064 | $49,319 | $4,920 | $44,399 |
| 2017 | $8,561 | $43,145 | $4,305 | $38,840 |
| 2016 | $9,621 | $48,035 | $4,305 | $43,730 |
| 2015 | $8,802 | $48,035 | $4,305 | $43,730 |
| 2014 | $7,662 | $41,297 | $3,690 | $37,607 |
| 2013 | $7,511 | $41,297 | $3,690 | $37,607 |
Source: Public Records
Map
Nearby Homes
- 2955 N Spaulding Ave
- 3042 N Sawyer Ave
- 2964 N Wisner Ave
- 2952 N Wisner Ave
- 2906 N Woodard St
- 2934 N Sawyer Ave
- 3054 N Kedzie Ave Unit 1F
- 3100 N Saint Louis Ave
- 3120 N Saint Louis Ave
- 3107 N Kedzie Ave
- 3027 N Elbridge Ave
- 3037 N Central Park Ave
- 3447 W Melrose St
- 2925 N Troy St
- 3141 N Central Park Ave
- 2836 N Drake Ave
- 3222 N Drake Ave
- 3244 N Drake Ave
- 3234 N Albany Ave
- 3315 N Drake Ave
- 3048 N Christiana Ave Unit 1
- 3048 N Christiana Ave
- 3050 N Christiana Ave
- 3044 N Christiana Ave
- 3052 N Christiana Ave
- 3052 N Christiana Ave Unit G
- 3042 N Christiana Ave Unit 2
- 3042 N Christiana Ave Unit 2
- 3042 N Christiana Ave Unit 1
- 3054 N Christiana Ave
- 3038 N Christiana Ave
- 3036 N Christiana Ave
- 3051 N Kimball Ave
- 3051 N Kimball Ave
- 3051 N Kimball Ave Unit 1
- 3057 N Kimball Ave
- 3032 N Christiana Ave
- 3043 N Kimball Ave
- 3045 N Kimball Ave
- 3041 N Kimball Ave