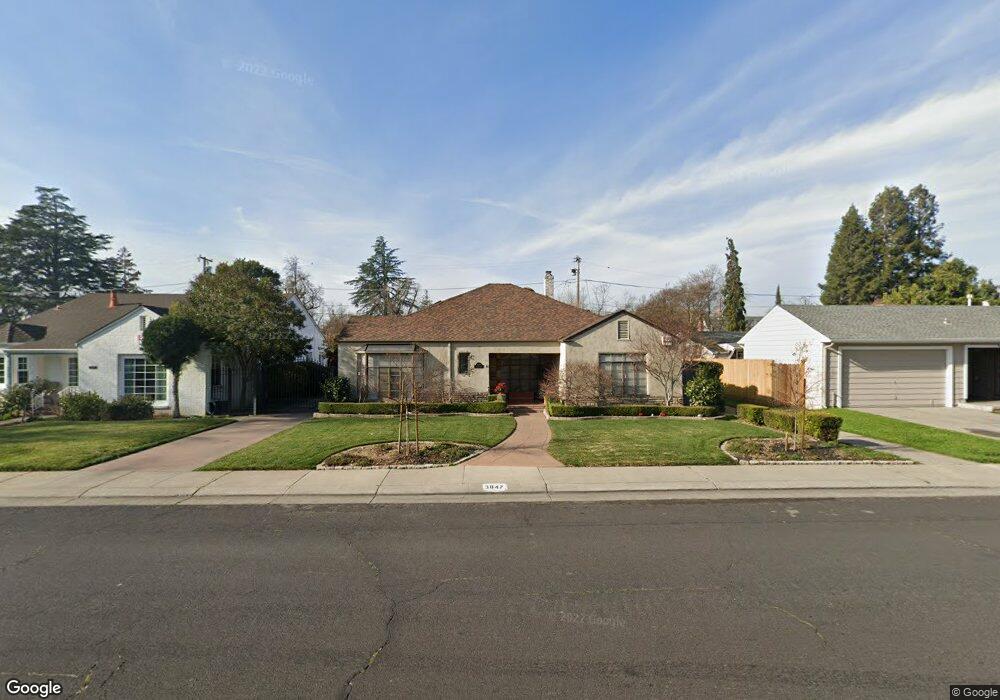
3047 Allston Way Unit 2 Stockton, CA 95204
Midtown NeighborhoodEstimated Value: $434,000 - $495,000
3
Beds
2
Baths
1,810
Sq Ft
$261/Sq Ft
Est. Value
About This Home
This home is located at 3047 Allston Way Unit 2, Stockton, CA 95204 and is currently estimated at $472,647, approximately $261 per square foot. 3047 Allston Way Unit 2 is a home located in San Joaquin County with nearby schools including Wilson Elementary School, El Dorado Elementary School, and Cleveland Elementary School.
Ownership History
Date
Name
Owned For
Owner Type
Purchase Details
Closed on
Jan 4, 2021
Sold by
Perovich Mark and Perovich Dolores
Bought by
Perovich Mark and Perovich Dolores
Current Estimated Value
Purchase Details
Closed on
Dec 22, 1998
Sold by
Perovich Mark W and Perovich Dolores Varelas
Bought by
Perovich Mark W and Perovich Dolores Varelas
Home Financials for this Owner
Home Financials are based on the most recent Mortgage that was taken out on this home.
Original Mortgage
$131,639
Outstanding Balance
$30,005
Interest Rate
6.82%
Mortgage Type
FHA
Estimated Equity
$442,642
Purchase Details
Closed on
Aug 7, 1996
Sold by
Hunefeld Hunefeld R and Hunefeld Georgette M
Bought by
Perovich Mark W and Varelas Dolores
Home Financials for this Owner
Home Financials are based on the most recent Mortgage that was taken out on this home.
Original Mortgage
$137,162
Interest Rate
8.18%
Mortgage Type
FHA
Create a Home Valuation Report for This Property
The Home Valuation Report is an in-depth analysis detailing your home's value as well as a comparison with similar homes in the area
Home Values in the Area
Average Home Value in this Area
Purchase History
| Date | Buyer | Sale Price | Title Company |
|---|---|---|---|
| Perovich Mark | -- | None Available | |
| Perovich Mark W | -- | First American Title | |
| Perovich Mark W | $140,000 | First American Title Co |
Source: Public Records
Mortgage History
| Date | Status | Borrower | Loan Amount |
|---|---|---|---|
| Open | Perovich Mark W | $131,639 | |
| Closed | Perovich Mark W | $137,162 |
Source: Public Records
Tax History Compared to Growth
Tax History
| Year | Tax Paid | Tax Assessment Tax Assessment Total Assessment is a certain percentage of the fair market value that is determined by local assessors to be the total taxable value of land and additions on the property. | Land | Improvement |
|---|---|---|---|---|
| 2025 | $2,861 | $227,916 | $73,283 | $154,633 |
| 2024 | $2,815 | $223,448 | $71,847 | $151,601 |
| 2023 | $2,752 | $219,068 | $70,439 | $148,629 |
| 2022 | $2,700 | $214,773 | $69,058 | $145,715 |
| 2021 | $9,364 | $210,562 | $67,704 | $142,858 |
| 2020 | $9,369 | $208,404 | $67,010 | $141,394 |
| 2019 | $9,359 | $204,319 | $65,697 | $138,622 |
| 2018 | $9,305 | $200,313 | $64,409 | $135,904 |
| 2017 | $9,150 | $196,387 | $63,147 | $133,240 |
| 2016 | $2,504 | $192,536 | $61,909 | $130,627 |
| 2014 | $2,383 | $185,931 | $59,785 | $126,146 |
Source: Public Records
Map
Nearby Homes
- 520 W Alpine Ave
- 423 W Monterey Ave
- 822 W Mariposa Ave
- 145 W Mendocino Ave
- 815 W Euclid Ave
- 844 W Euclid Ave
- 635 N Regent St
- 110 W Monterey Ave
- 960 Bristol Ave
- 2625 Westminister Ave
- 409 S Central Ave
- 1060 W Monterey Ave
- 1071 W Monterey Ave
- 674 N Tuxedo Ave
- 1030 Elmwood Ave
- 2820 N El Dorado St
- 1019 S Country Club Blvd
- 129 E Sonoma Ave
- 144 E Sonoma Ave
- 217 W Essex St
- 3039 Allston Way
- 3205 Allston Way
- 3116 Dwight Way
- 3033 Allston Way Unit 2
- 3100 Dwight Way
- 3040 Dwight Way
- 3025 Allston Way
- 3136 Dwight Way
- 3225 Allston Way
- 3030 Dwight Way
- 3206 Dwight Way Unit 4
- 3109 Dwight Way
- 3016 Dwight Way
- 3237 Allston Way
- 3214 Dwight Way Unit 4
- 3005 Allston Way
- 3031 Dwight Way
- 625 W Mariposa Ave
- 657 W Mendocino Ave