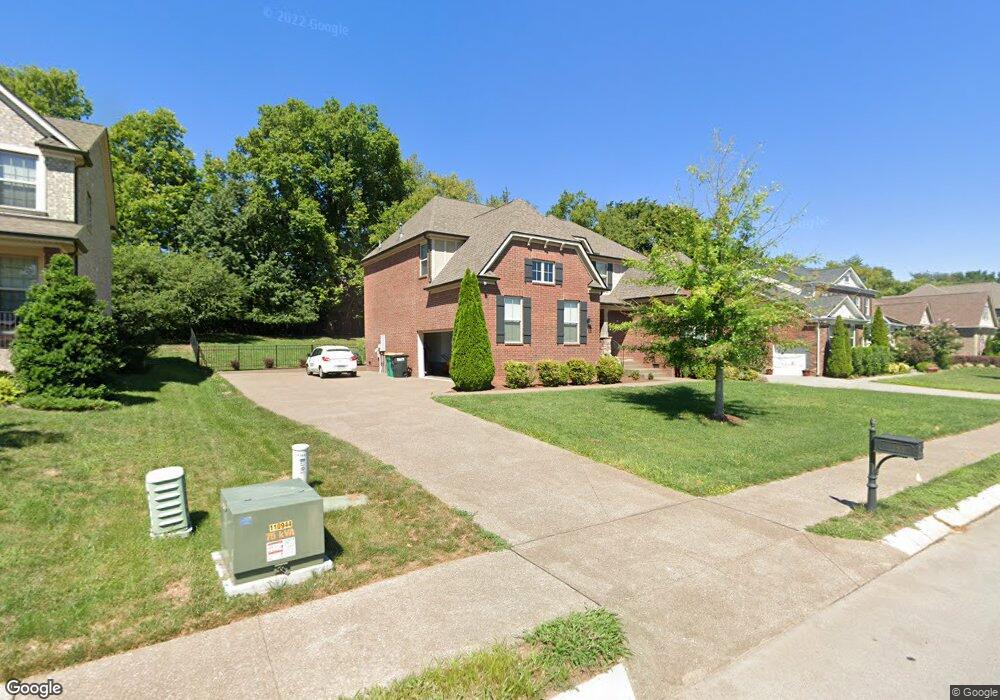
3047 Everleigh Pl - Lot 37 Spring Hill, TN 37174
Estimated Value: $693,728 - $728,000
--
Bed
3
Baths
2,682
Sq Ft
$262/Sq Ft
Est. Value
About This Home
This home is located at 3047 Everleigh Pl - Lot 37, Spring Hill, TN 37174 and is currently estimated at $702,682, approximately $261 per square foot. 3047 Everleigh Pl - Lot 37 is a home located in Williamson County with nearby schools including Primrose School of Spring Hill and Columbia Academy at Spring Hill.
Ownership History
Date
Name
Owned For
Owner Type
Purchase Details
Closed on
Dec 4, 2017
Sold by
Sowers David and Sowers Amy
Bought by
Clark Alan M and Clark Meghan E
Current Estimated Value
Home Financials for this Owner
Home Financials are based on the most recent Mortgage that was taken out on this home.
Original Mortgage
$309,600
Outstanding Balance
$260,656
Interest Rate
3.94%
Mortgage Type
New Conventional
Estimated Equity
$442,026
Purchase Details
Closed on
Sep 18, 2014
Sold by
The Jones Company Of Tennessee Llc
Bought by
Sowers David and Sowers Amy
Home Financials for this Owner
Home Financials are based on the most recent Mortgage that was taken out on this home.
Original Mortgage
$297,592
Interest Rate
4.2%
Mortgage Type
New Conventional
Purchase Details
Closed on
May 19, 2014
Sold by
Harvey Development Llc
Bought by
The Jones Co Of Tennessee Llc
Create a Home Valuation Report for This Property
The Home Valuation Report is an in-depth analysis detailing your home's value as well as a comparison with similar homes in the area
Home Values in the Area
Average Home Value in this Area
Purchase History
| Date | Buyer | Sale Price | Title Company |
|---|---|---|---|
| Clark Alan M | $387,000 | None Available | |
| Sowers David | $31,255 | Southland Title & Escrow Co | |
| The Jones Co Of Tennessee Llc | $131,625 | Stewart Title Co Tennessee D |
Source: Public Records
Mortgage History
| Date | Status | Borrower | Loan Amount |
|---|---|---|---|
| Open | Clark Alan M | $309,600 | |
| Previous Owner | Sowers David | $297,592 |
Source: Public Records
Tax History Compared to Growth
Tax History
| Year | Tax Paid | Tax Assessment Tax Assessment Total Assessment is a certain percentage of the fair market value that is determined by local assessors to be the total taxable value of land and additions on the property. | Land | Improvement |
|---|---|---|---|---|
| 2024 | $768 | $103,900 | $21,250 | $82,650 |
| 2023 | $768 | $103,900 | $21,250 | $82,650 |
| 2022 | $1,901 | $103,900 | $21,250 | $82,650 |
| 2021 | $1,901 | $103,900 | $21,250 | $82,650 |
| 2020 | $1,772 | $82,025 | $16,250 | $65,775 |
| 2019 | $1,772 | $82,025 | $16,250 | $65,775 |
| 2018 | $1,714 | $82,025 | $16,250 | $65,775 |
| 2017 | $1,698 | $82,025 | $16,250 | $65,775 |
| 2016 | $0 | $82,025 | $16,250 | $65,775 |
| 2015 | -- | $74,275 | $13,500 | $60,775 |
| 2014 | -- | $74,275 | $13,500 | $60,775 |
Source: Public Records
Map
Nearby Homes
- 3041 Everleigh Place
- 2040 Belshire Way
- 8009 June Apple Ln
- 8027 Puddleduck Ln
- 4007 Pendleton Dr
- 4111 Miles Johnson Pkwy
- 411 Drakes Way
- Preston Park Condo 2 Bedroom Plan at Preston Park - Condos
- Preston Park Townhomes 2 Bedroom Plan at Preston Park - Townhomes
- Preston Park Condo 1 Bedroom Plan at Preston Park - Condos
- Preston Park Townhomes 2 Bedroom W/Balcony Plan at Preston Park - Townhomes
- Preston Park Townhomes 3 Bedroom Plan at Preston Park - Townhomes
- 5004 Paint Creek Ct
- 7011 Salmon Run
- 1025 Cantwell Place
- 223B Folsom Pass
- 227 Folsom Pass Unit 227A
- 223 Folsom Pass
- 221 Folsom Pass
- Preston Plan at Preston Park
- 3047 Everleigh Place
- 3045 Everleigh Place
- 3049 Everleigh Place
- 3045 Everleigh Pl - Lot 38
- 4007 Pinhill Pass L-119
- 4028 Haversack Dr
- 4028 Haversack Dr
- 3051 Everleigh Place
- 5007 Pinhill Pass- Lot 119
- 3043 Everleigh Place
- 4026 Haversack Dr
- 3051 Everleigh Place
- 5008 Pinhill Pass Unit 124
- 5008 Pinhill Pass
- 5008 Pinhill Pass
- 4026 Haversack Dr
- 4030 Haversack Dr
- 4024 Haversack Dr
- 4030 Haversack Dr
- 4024 Haversack Dr