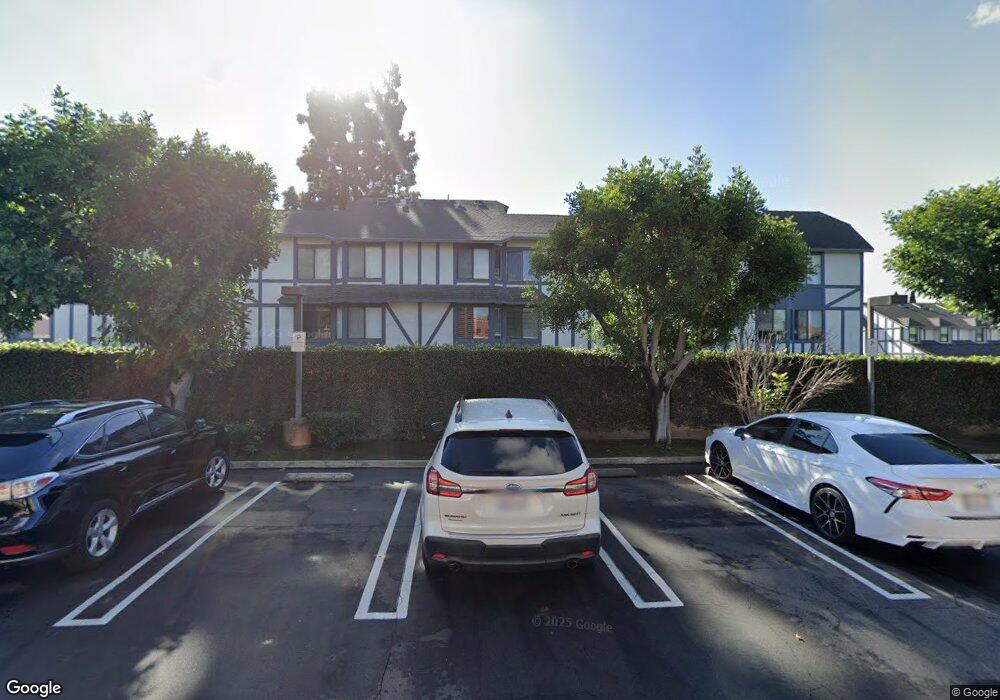
3047 W Cheryllyn Ln Unit 33 Anaheim, CA 92804
West Anaheim NeighborhoodEstimated Value: $613,000 - $696,000
3
Beds
2
Baths
1,339
Sq Ft
$490/Sq Ft
Est. Value
About This Home
This home is located at 3047 W Cheryllyn Ln Unit 33, Anaheim, CA 92804 and is currently estimated at $655,480, approximately $489 per square foot. 3047 W Cheryllyn Ln Unit 33 is a home located in Orange County with nearby schools including Twila Reid Elementary, Orangeview Junior High, and Western High School.
Ownership History
Date
Name
Owned For
Owner Type
Purchase Details
Closed on
Jan 3, 2014
Sold by
Lim Ho Kwang and Park Ki Chun
Bought by
Lim Terry Young and Ahn Jin Kyung
Current Estimated Value
Purchase Details
Closed on
Sep 24, 1997
Sold by
Federal National Mortgage Association
Bought by
Lim Ho Kwang and Lim Ki Chun
Home Financials for this Owner
Home Financials are based on the most recent Mortgage that was taken out on this home.
Original Mortgage
$69,000
Outstanding Balance
$10,712
Interest Rate
7.49%
Mortgage Type
Unknown
Estimated Equity
$644,768
Purchase Details
Closed on
Aug 18, 1997
Sold by
Stacker Michael B and Stacker Erin L
Bought by
Federal National Mortgage Association
Home Financials for this Owner
Home Financials are based on the most recent Mortgage that was taken out on this home.
Original Mortgage
$69,000
Outstanding Balance
$10,712
Interest Rate
7.49%
Mortgage Type
Unknown
Estimated Equity
$644,768
Create a Home Valuation Report for This Property
The Home Valuation Report is an in-depth analysis detailing your home's value as well as a comparison with similar homes in the area
Home Values in the Area
Average Home Value in this Area
Purchase History
| Date | Buyer | Sale Price | Title Company |
|---|---|---|---|
| Lim Terry Young | -- | Fidelity Sherman Oaks | |
| Lim Terry Young | -- | Accommodation | |
| Lim Ho Kwang | $94,500 | Fidelity National Title Ins | |
| Federal National Mortgage Association | $99,500 | Chicago Title |
Source: Public Records
Mortgage History
| Date | Status | Borrower | Loan Amount |
|---|---|---|---|
| Open | Lim Ho Kwang | $69,000 |
Source: Public Records
Tax History Compared to Growth
Tax History
| Year | Tax Paid | Tax Assessment Tax Assessment Total Assessment is a certain percentage of the fair market value that is determined by local assessors to be the total taxable value of land and additions on the property. | Land | Improvement |
|---|---|---|---|---|
| 2025 | $1,955 | $150,882 | $23,956 | $126,926 |
| 2024 | $1,955 | $147,924 | $23,486 | $124,438 |
| 2023 | $1,902 | $145,024 | $23,025 | $121,999 |
| 2022 | $1,860 | $142,181 | $22,574 | $119,607 |
| 2021 | $1,871 | $139,394 | $22,132 | $117,262 |
| 2020 | $1,846 | $137,965 | $21,905 | $116,060 |
| 2019 | $1,800 | $135,260 | $21,475 | $113,785 |
| 2018 | $1,774 | $132,608 | $21,054 | $111,554 |
| 2017 | $1,717 | $130,008 | $20,641 | $109,367 |
| 2016 | $1,707 | $127,459 | $20,236 | $107,223 |
| 2015 | $1,686 | $125,545 | $19,932 | $105,613 |
| 2014 | $1,683 | $123,086 | $19,541 | $103,545 |
Source: Public Records
Map
Nearby Homes
- 716 S Hayward St Unit 2
- 612 S Halliday St
- 3115 W Teranimar Dr
- 900 S Hayward St
- 2945 W Bridgeport Ave
- 235 S Beach Blvd Unit 132
- 2942 W Floyd Ave
- 211 S Beach Blvd Unit 92
- 3050 W Ball Rd Unit 115B
- 3050 W Ball Rd Unit 88
- 3050 W Ball Rd Unit 127
- 3050 W Ball Rd Unit 132
- 3050 W Ball Rd Unit 152
- 3050 W Ball Rd Unit 82
- 3050 W Ball Rd Unit 171
- 3050 W Ball Rd Unit 200
- 1203 S Courtright St
- 103 S Laxore St
- 106 S Laxore St Unit 407
- 107 S Laxore St
- 3049 W Cheryllyn Ln
- 3051 W Cheryllyn Ln Unit 35
- 3053 W Cheryllyn Ln Unit 36
- 3061 W Cheryllyn Ln Unit 39
- 3063 W Cheryllyn Ln Unit 40
- 3059 W Cheryllyn Ln Unit 38
- 3057 W Cheryllyn Ln Unit 37
- 3066 W Cheryllyn Ln Unit 31
- 3064 W Cheryllyn Ln Unit 32
- 696 S Lassen Ct
- 704 S Lassen Ct Unit 1
- 704 S Lassen Ct
- 3062 W Cheryllyn Ln Unit 29
- 688 S Lassen Ct
- 712 S Lassen Ct
- 3058 W Cheryllyn Ln Unit 27
- 3080 W Cheryllyn Ln Unit 57
- 3076 W Cheryllyn Ln Unit 59
- 3076 W Cheryllyn Ln
- 3056 W Cheryllyn Ln Unit 28