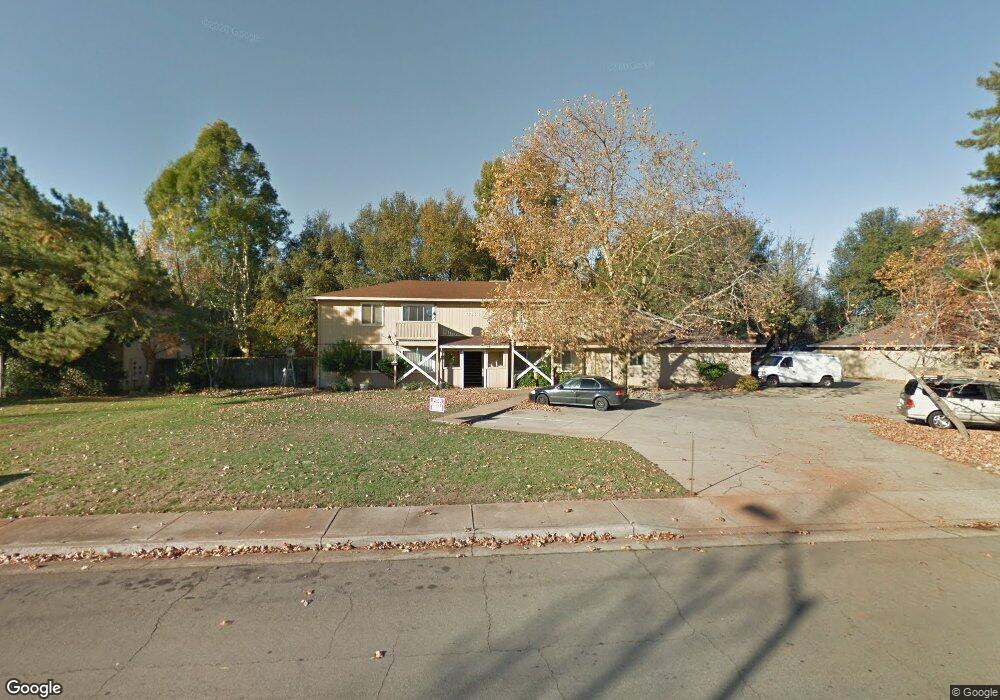
3048 Catalpa Ct Units 1-4 Unit s 1-4 Redding, CA 96002
Enterprise NeighborhoodEstimated Value: $527,000 - $602,000
2
Beds
1
Bath
900
Sq Ft
$625/Sq Ft
Est. Value
About This Home
This home is located at 3048 Catalpa Ct Units 1-4 Unit s 1-4, Redding, CA 96002 and is currently estimated at $562,209, approximately $624 per square foot. 3048 Catalpa Ct Units 1-4 Unit s 1-4 is a home located in Shasta County with nearby schools including Shasta Meadows Elementary School, Parsons Junior High School, and Enterprise High School.
Ownership History
Date
Name
Owned For
Owner Type
Purchase Details
Closed on
Jan 26, 2021
Sold by
Arteaga Raudel
Bought by
Anstine Luke V
Current Estimated Value
Home Financials for this Owner
Home Financials are based on the most recent Mortgage that was taken out on this home.
Original Mortgage
$454,613
Outstanding Balance
$406,390
Interest Rate
2.67%
Mortgage Type
FHA
Estimated Equity
$155,819
Purchase Details
Closed on
Aug 20, 2011
Sold by
Arteaga Raudel and Arteaga Irma D
Bought by
Arteaga Raudel
Purchase Details
Closed on
Sep 13, 2000
Sold by
Jenkins Robert D
Bought by
Jenkins Mary B
Purchase Details
Closed on
Jul 14, 2000
Sold by
Jenkins Mary B and Jenkins Robert D
Bought by
Jenkins Robert D and Jenkins Mary B
Purchase Details
Closed on
Jun 21, 2000
Sold by
Roberts Donald Colter
Bought by
Jenkins Mary B
Create a Home Valuation Report for This Property
The Home Valuation Report is an in-depth analysis detailing your home's value as well as a comparison with similar homes in the area
Home Values in the Area
Average Home Value in this Area
Purchase History
| Date | Buyer | Sale Price | Title Company |
|---|---|---|---|
| Anstine Luke V | $463,000 | Fidelity Natl Ttl Co Of Ca | |
| Arteaga Raudel | -- | None Available | |
| Jenkins Mary B | -- | -- | |
| Jenkins Robert D | -- | Chicago Title Co | |
| Jenkins Mary B | $323,000 | Chicago Title Co |
Source: Public Records
Mortgage History
| Date | Status | Borrower | Loan Amount |
|---|---|---|---|
| Open | Anstine Luke V | $454,613 |
Source: Public Records
Tax History Compared to Growth
Tax History
| Year | Tax Paid | Tax Assessment Tax Assessment Total Assessment is a certain percentage of the fair market value that is determined by local assessors to be the total taxable value of land and additions on the property. | Land | Improvement |
|---|---|---|---|---|
| 2025 | $5,467 | $501,163 | $86,593 | $414,570 |
| 2024 | $5,391 | $491,338 | $84,896 | $406,442 |
| 2023 | $5,391 | $481,705 | $83,232 | $398,473 |
| 2022 | $5,239 | $472,260 | $81,600 | $390,660 |
| 2021 | $5,061 | $463,000 | $80,000 | $383,000 |
| 2020 | $4,301 | $390,000 | $75,000 | $315,000 |
| 2019 | $4,350 | $390,000 | $75,000 | $315,000 |
| 2018 | $3,556 | $315,000 | $60,000 | $255,000 |
| 2017 | $3,517 | $300,000 | $50,000 | $250,000 |
| 2016 | $2,809 | $250,000 | $50,000 | $200,000 |
| 2015 | $2,601 | $231,000 | $50,000 | $181,000 |
| 2014 | $2,510 | $220,000 | $40,000 | $180,000 |
Source: Public Records
Map
Nearby Homes
- 3283 Middleton Ln
- 3293 Middleton Ln
- 3178 Lawrence Rd
- 2796 Kenco Ave
- 3340 Hartnell Ave
- 3341 Timbercreek Dr
- 2820 Alfreda Way
- 3466 Silverwood St
- 3710 Indio Way
- 3475 Oak Haven Ct
- 3628 Somerset Ave
- 1091 Del Sol Place
- 2915 Rockabye Ln
- 2953 Churn Ct
- 1201 Echo Rd
- 1535 E Cypress Ave
- 1221 E Cypress Ave Unit 67
- 0 Churn Creek Rd Unit 25-496
- 1153 Ruthie Ln
- 3703 Harrow Ct
- 3064 Catalpa Ct
- 3032 Catalpa Ct
- 3121 Middleton Ln
- 3093 Middleton La
- 3093 Middleton
- 3039 Catalpa Ct
- 3071 Catalpa Ct
- 3016 Catalpa Ct
- 1626 Bramble Place
- 3081 Middleton Ln
- 3181 Middleton Ln
- 1566 Bramble Place
- 1642 Bramble Place
- 3023 Catalpa Ct
- 3055 Middleton Ln
- 1658 Bramble Place
- 3000 Catalpa Ct
- 1601 Bramble Place