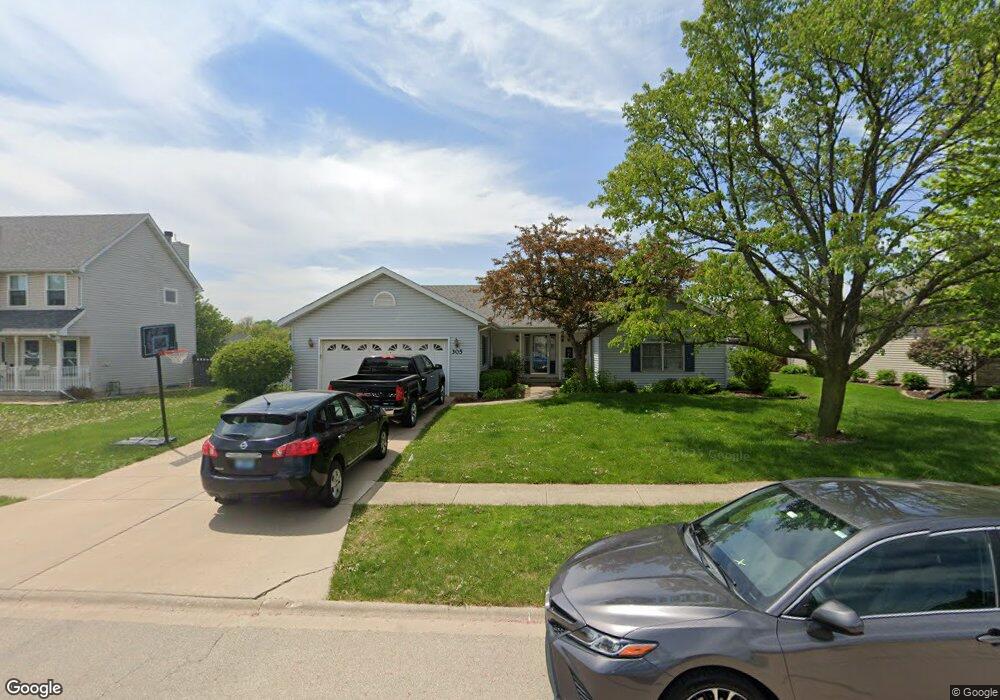
305 Chippewa Dr Minooka, IL 60447
Estimated Value: $334,000 - $375,702
3
Beds
2
Baths
1,782
Sq Ft
$200/Sq Ft
Est. Value
About This Home
This home is located at 305 Chippewa Dr, Minooka, IL 60447 and is currently estimated at $355,926, approximately $199 per square foot. 305 Chippewa Dr is a home located in Grundy County with nearby schools including Minooka Primary Center, Minooka Elementary School, and Minooka Junior High School.
Ownership History
Date
Name
Owned For
Owner Type
Purchase Details
Closed on
Mar 25, 2019
Sold by
Frantini Thomas
Bought by
Frantini Brett
Current Estimated Value
Home Financials for this Owner
Home Financials are based on the most recent Mortgage that was taken out on this home.
Original Mortgage
$188,000
Interest Rate
4.75%
Mortgage Type
New Conventional
Purchase Details
Closed on
Nov 25, 2014
Sold by
Thomas H Thomas H and Frantini Jami
Bought by
Frantini Thomas H
Create a Home Valuation Report for This Property
The Home Valuation Report is an in-depth analysis detailing your home's value as well as a comparison with similar homes in the area
Purchase History
| Date | Buyer | Sale Price | Title Company |
|---|---|---|---|
| Frantini Brett | $235,000 | None Available | |
| Frantini Thomas H | -- | -- |
Source: Public Records
Mortgage History
| Date | Status | Borrower | Loan Amount |
|---|---|---|---|
| Previous Owner | Frantini Brett | $188,000 |
Source: Public Records
Tax History
| Year | Tax Paid | Tax Assessment Tax Assessment Total Assessment is a certain percentage of the fair market value that is determined by local assessors to be the total taxable value of land and additions on the property. | Land | Improvement |
|---|---|---|---|---|
| 2024 | $8,649 | $107,827 | $19,374 | $88,453 |
| 2023 | $7,884 | $98,283 | $17,659 | $80,624 |
| 2022 | $6,849 | $91,383 | $16,419 | $74,964 |
| 2021 | $6,558 | $86,504 | $15,542 | $70,962 |
| 2020 | $6,396 | $82,749 | $14,867 | $67,882 |
| 2019 | $6,040 | $76,620 | $13,766 | $62,854 |
| 2018 | $6,073 | $75,297 | $13,612 | $61,685 |
| 2017 | $5,896 | $71,903 | $12,998 | $58,905 |
| 2016 | $5,506 | $67,495 | $12,201 | $55,294 |
| 2015 | $4,731 | $61,354 | $11,091 | $50,263 |
| 2014 | $4,297 | $57,969 | $10,479 | $47,490 |
| 2013 | $4,416 | $58,750 | $10,620 | $48,130 |
Source: Public Records
Map
Nearby Homes
- 300 Arrowhead Dr
- 214 Deerpath Dr
- 701 Davidson Dr Unit B
- 105 Blackhawk Dr
- 204 N Wabasso St
- 201 W Church St
- 405 W Mondamin St
- 517 Rivers Edge Dr
- 521 Rivers Edge Dr
- 103 Northfield Dr
- 105 Northfield Dr
- 9015 E Mcevilly Rd
- LOT 1 Bob Blair Rd
- 323 Vista Ct Unit B
- 25734 Hickory Ct
- 24055 S Lakeview Dr
- 1308 Kettleson Dr
- 706 O Toole Dr
- 601 Edgewater Dr
- 330 Clover Cir
- 303 Chippewa Dr
- 307 Chippewa Dr
- 308 Arrowhead Dr
- 312 Arrowhead Dr
- 304 Arrowhead Dr
- 301 Chippewa Dr
- 301 Chippewa Dr
- 301 Chippewa Dr
- 309 Chippewa Dr
- 306 Chippewa Dr
- 304 Chippewa Dr
- 316 Arrowhead Dr
- 308 Chippewa Dr
- 302 Chippewa Dr
- 310 Chippewa Dr
- 311 Chippewa Dr
- 320 Arrowhead Dr
- 313 Arrowhead Dr
- 305 Arrowhead Dr
- 303 Deerpath Dr
Your Personal Tour Guide
Ask me questions while you tour the home.