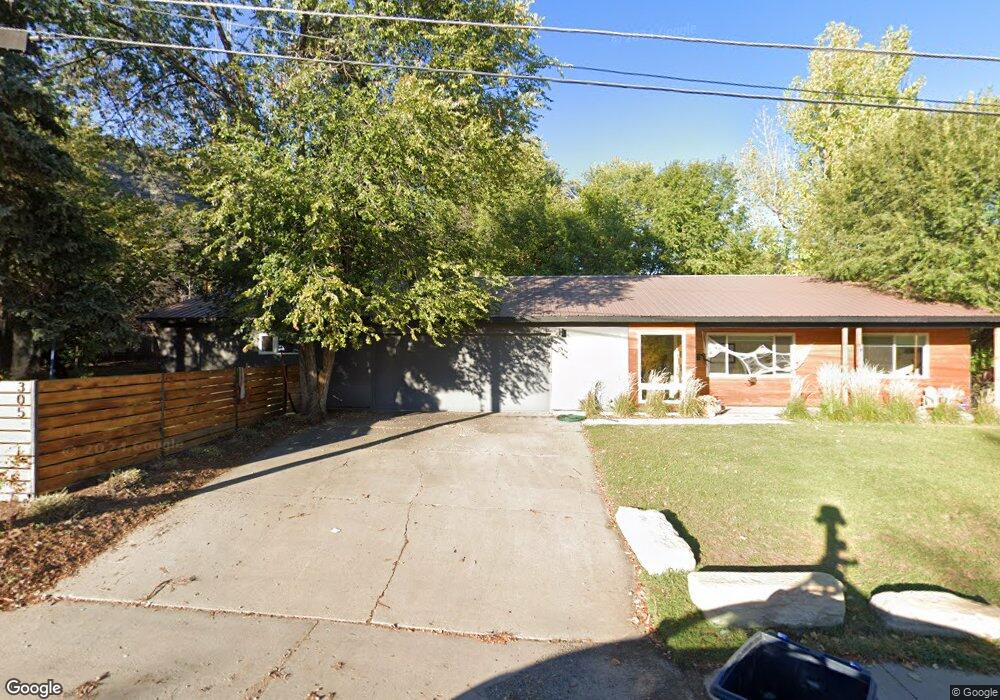
305 E 36th St Durango, CO 81301
Estimated Value: $838,000 - $904,000
4
Beds
2
Baths
1,712
Sq Ft
$508/Sq Ft
Est. Value
About This Home
This home is located at 305 E 36th St, Durango, CO 81301 and is currently estimated at $869,479, approximately $507 per square foot. 305 E 36th St is a home located in La Plata County with nearby schools including Riverview Elementary School, Miller Middle School, and Durango High School.
Ownership History
Date
Name
Owned For
Owner Type
Purchase Details
Closed on
May 18, 2017
Sold by
Downing Trevor M and Mccarthy Corrie M
Bought by
Wilk Michael Nickerson and Mik Natalie Gene
Current Estimated Value
Home Financials for this Owner
Home Financials are based on the most recent Mortgage that was taken out on this home.
Original Mortgage
$424,100
Interest Rate
3.97%
Mortgage Type
Construction
Purchase Details
Closed on
Aug 7, 2013
Sold by
Cochran Russell T and Stearns Cochran Barbara
Bought by
Downing Trevor M and Mccarthy Corrie M
Home Financials for this Owner
Home Financials are based on the most recent Mortgage that was taken out on this home.
Original Mortgage
$309,183
Interest Rate
4.49%
Mortgage Type
New Conventional
Purchase Details
Closed on
Sep 8, 2008
Sold by
Cochran Russell T and Cochran Russell
Bought by
Cochran Russell T and Stearns Cochran Barbara
Create a Home Valuation Report for This Property
The Home Valuation Report is an in-depth analysis detailing your home's value as well as a comparison with similar homes in the area
Purchase History
| Date | Buyer | Sale Price | Title Company |
|---|---|---|---|
| Wilk Michael Nickerson | $440,000 | None Available | |
| Downing Trevor M | $303,000 | Land Title | |
| Cochran Russell T | -- | None Available |
Source: Public Records
Mortgage History
| Date | Status | Borrower | Loan Amount |
|---|---|---|---|
| Closed | Wilk Michael Nickerson | $424,100 | |
| Previous Owner | Downing Trevor M | $309,183 |
Source: Public Records
Tax History
| Year | Tax Paid | Tax Assessment Tax Assessment Total Assessment is a certain percentage of the fair market value that is determined by local assessors to be the total taxable value of land and additions on the property. | Land | Improvement |
|---|---|---|---|---|
| 2025 | $1,653 | $46,370 | $18,240 | $28,130 |
| 2024 | $1,406 | $34,980 | $13,320 | $21,660 |
| 2023 | $1,406 | $38,030 | $14,480 | $23,550 |
| 2022 | $1,259 | $40,110 | $15,270 | $24,840 |
| 2021 | $1,264 | $31,850 | $13,130 | $18,720 |
| 2020 | $1,176 | $30,580 | $12,970 | $17,610 |
| 2019 | $1,125 | $30,580 | $12,970 | $17,610 |
| 2018 | $1,060 | $29,170 | $12,300 | $16,870 |
| 2017 | $959 | $27,010 | $12,300 | $14,710 |
| 2016 | $877 | $26,900 | $11,750 | $15,150 |
| 2015 | $809 | $26,490 | $11,750 | $14,740 |
| 2014 | -- | $23,660 | $11,290 | $12,370 |
| 2013 | -- | $23,660 | $11,290 | $12,370 |
Source: Public Records
Map
Nearby Homes
- 3575 Main Ave
- 288 Animas View Dr Unit 9
- 288 Animas View Dr Unit 11
- 288 Animas View Dr Unit 121
- 3211 W 2 Nd Ave
- 35 Sunshine Ct Unit 1
- 35 Sunshine Ct Unit 3
- 35 Sunshine Ct Unit 6
- 580 Animas View Dr Unit 1
- 601 Animas View Dr Unit 204A
- 3015 Hillside Ave
- 2718 New Mexico Ave Unit D
- 1110 Animas View Dr
- 1200 Florida Rd Unit 7
- 900 Florida Rd
- 416 W 28th St
- 18 Miller Dr
- 24 Sage Hill Ct
- 180 Metz Ln Unit 1302
- 170 Metz Ln
- 217 E 37th St
- 307 E 36th St
- 300 E 37th St
- 211 E 37th St
- 211 E 37th St Unit access on 36th Stree
- 3521 Bennett St
- 3522 Bennett St
- 306 E 37th St
- 3519 Bennett St
- 3520 Bennett St
- 309 E 36th St
- 210 E 36th St
- 306 E 36th St
- E 37th St Unit access on 36th Stree
- E 37th St
- 310 E 37th St
- 209 E 37th St
- 0 Earl St
- 3577 Earl St
- 3517 Bennett St
Your Personal Tour Guide
Ask me questions while you tour the home.