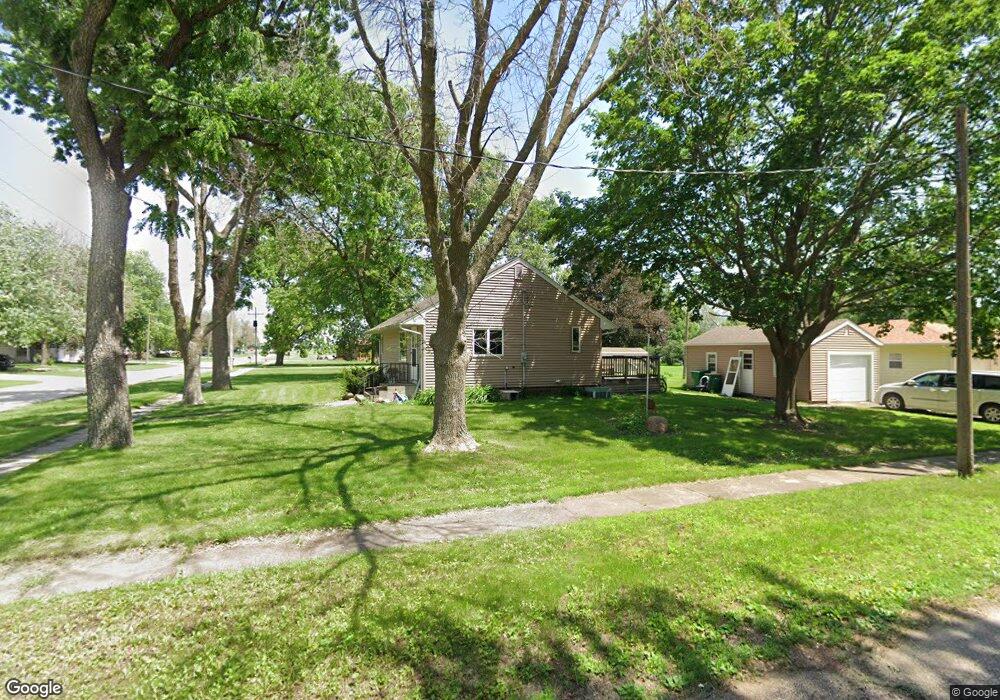
305 E 5th St Kanawha, IA 50447
Estimated Value: $62,000 - $95,000
3
Beds
1
Bath
864
Sq Ft
$94/Sq Ft
Est. Value
About This Home
This home is located at 305 E 5th St, Kanawha, IA 50447 and is currently estimated at $81,544, approximately $94 per square foot. 305 E 5th St is a home with nearby schools including West Hancock Elementary School, West Hancock Middle School, and West Hancock High School.
Ownership History
Date
Name
Owned For
Owner Type
Purchase Details
Closed on
Jan 18, 2022
Sold by
Walk Doreen L and Walk David F
Bought by
Kitley Kirsten and Hoveland Lilli
Current Estimated Value
Home Financials for this Owner
Home Financials are based on the most recent Mortgage that was taken out on this home.
Original Mortgage
$54,382
Outstanding Balance
$50,120
Interest Rate
3.11%
Mortgage Type
FHA
Estimated Equity
$31,424
Purchase Details
Closed on
Jul 20, 2021
Sold by
Davis Penny J and Davis Elmer
Bought by
Walk Doreen L
Create a Home Valuation Report for This Property
The Home Valuation Report is an in-depth analysis detailing your home's value as well as a comparison with similar homes in the area
Home Values in the Area
Average Home Value in this Area
Purchase History
| Date | Buyer | Sale Price | Title Company |
|---|---|---|---|
| Kitley Kirsten | $56,500 | None Listed On Document | |
| Walk Doreen L | $10,000 | None Listed On Document |
Source: Public Records
Mortgage History
| Date | Status | Borrower | Loan Amount |
|---|---|---|---|
| Open | Kitley Kirsten | $54,382 |
Source: Public Records
Tax History Compared to Growth
Tax History
| Year | Tax Paid | Tax Assessment Tax Assessment Total Assessment is a certain percentage of the fair market value that is determined by local assessors to be the total taxable value of land and additions on the property. | Land | Improvement |
|---|---|---|---|---|
| 2025 | $920 | $73,790 | $18,800 | $54,990 |
| 2024 | $920 | $63,720 | $11,750 | $51,970 |
| 2023 | $1,018 | $63,720 | $11,750 | $51,970 |
| 2022 | $843 | $51,970 | $11,750 | $40,220 |
| 2021 | $806 | $41,720 | $11,750 | $29,970 |
| 2020 | $806 | $41,700 | $11,750 | $29,950 |
| 2019 | $784 | $41,700 | $11,750 | $29,950 |
| 2018 | $794 | $36,990 | $11,750 | $25,240 |
| 2017 | $794 | $32,300 | $0 | $0 |
| 2016 | $654 | $32,300 | $0 | $0 |
| 2015 | $654 | $31,820 | $0 | $0 |
| 2014 | $616 | $31,820 | $0 | $0 |
Source: Public Records
Map
Nearby Homes